Otolemur garnettii (Small-eared galago) (Garnett s greater bushbaby)
Taxonomy: cellular organisms; Eukaryota; Opisthokonta; Metazoa; Eumetazoa; Bilateria; Deuterostomia; Chordata; Craniata; Vertebrata; Gnathostomata; Teleostomi; Euteleostomi; Sarcopterygii; Dipnotetrapodomorpha; Tetrapoda; Amniota; Mammalia; Theria; Eutheria; Boreoeutheria; Euarchontoglires;
Average proteome isoelectric point is 6.76
Get precalculated fractions of proteins

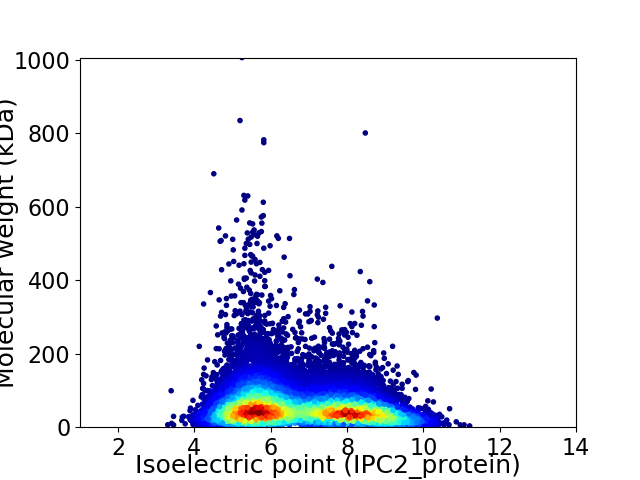
Virtual 2D-PAGE plot for 19931 proteins (isoelectric point calculated using IPC2_protein)
Get csv file with sequences according to given criteria:
* You can choose from 21 different methods for calculating isoelectric point
Summary statistics related to proteome-wise predictions


Protein with the lowest isoelectric point:
>tr|H0XWI8|H0XWI8_OTOGA Uncharacterized protein OS=Otolemur garnettii OX=30611 PE=3 SV=1
PP1 pKa = 6.9ATSLLLLLLLLFLRR15 pKa = 11.84CSEE18 pKa = 4.18LGEE21 pKa = 4.16GVRR24 pKa = 11.84FGQKK28 pKa = 8.14DD29 pKa = 3.73TKK31 pKa = 10.2VLRR34 pKa = 11.84ARR36 pKa = 11.84RR37 pKa = 11.84DD38 pKa = 3.38GVRR41 pKa = 11.84VLGRR45 pKa = 11.84GTSWASDD52 pKa = 3.08RR53 pKa = 11.84AGPEE57 pKa = 3.33QRR59 pKa = 11.84YY60 pKa = 9.56GIVGTRR66 pKa = 11.84QNVSTEE72 pKa = 4.34GPASSHH78 pKa = 5.85EE79 pKa = 4.04NSGTRR84 pKa = 11.84EE85 pKa = 4.01NDD87 pKa = 3.03STTDD91 pKa = 3.2PGTTEE96 pKa = 5.35DD97 pKa = 4.34YY98 pKa = 9.95VTTEE102 pKa = 4.87DD103 pKa = 5.32YY104 pKa = 10.13VTTDD108 pKa = 3.16PGTTDD113 pKa = 4.69DD114 pKa = 5.38YY115 pKa = 11.44VTTDD119 pKa = 3.83LRR121 pKa = 11.84TTDD124 pKa = 4.87DD125 pKa = 4.29YY126 pKa = 11.82VTTDD130 pKa = 3.01PGTTEE135 pKa = 5.66DD136 pKa = 5.15YY137 pKa = 8.6VTPDD141 pKa = 3.34PGTTDD146 pKa = 4.5DD147 pKa = 5.59YY148 pKa = 11.47VTTDD152 pKa = 3.01PGTTEE157 pKa = 5.4DD158 pKa = 5.17YY159 pKa = 9.97VTTDD163 pKa = 3.92LGTTDD168 pKa = 5.56DD169 pKa = 5.04YY170 pKa = 11.76VTTDD174 pKa = 3.01PGTTEE179 pKa = 5.43DD180 pKa = 4.57YY181 pKa = 8.14TTEE184 pKa = 4.73DD185 pKa = 4.34YY186 pKa = 10.2VTTDD190 pKa = 2.82PGTTEE195 pKa = 5.47DD196 pKa = 5.27YY197 pKa = 9.98VTTDD201 pKa = 2.82PGTTEE206 pKa = 5.47DD207 pKa = 4.63YY208 pKa = 9.16VTSDD212 pKa = 2.69RR213 pKa = 11.84GTTEE217 pKa = 5.32DD218 pKa = 4.41YY219 pKa = 9.28VTSDD223 pKa = 2.69RR224 pKa = 11.84GTTEE228 pKa = 5.27DD229 pKa = 5.4YY230 pKa = 10.0VTTDD234 pKa = 2.42QGTTEE239 pKa = 5.13DD240 pKa = 4.65YY241 pKa = 9.99VTTDD245 pKa = 3.95LEE247 pKa = 4.69TTAHH251 pKa = 6.38
PP1 pKa = 6.9ATSLLLLLLLLFLRR15 pKa = 11.84CSEE18 pKa = 4.18LGEE21 pKa = 4.16GVRR24 pKa = 11.84FGQKK28 pKa = 8.14DD29 pKa = 3.73TKK31 pKa = 10.2VLRR34 pKa = 11.84ARR36 pKa = 11.84RR37 pKa = 11.84DD38 pKa = 3.38GVRR41 pKa = 11.84VLGRR45 pKa = 11.84GTSWASDD52 pKa = 3.08RR53 pKa = 11.84AGPEE57 pKa = 3.33QRR59 pKa = 11.84YY60 pKa = 9.56GIVGTRR66 pKa = 11.84QNVSTEE72 pKa = 4.34GPASSHH78 pKa = 5.85EE79 pKa = 4.04NSGTRR84 pKa = 11.84EE85 pKa = 4.01NDD87 pKa = 3.03STTDD91 pKa = 3.2PGTTEE96 pKa = 5.35DD97 pKa = 4.34YY98 pKa = 9.95VTTEE102 pKa = 4.87DD103 pKa = 5.32YY104 pKa = 10.13VTTDD108 pKa = 3.16PGTTDD113 pKa = 4.69DD114 pKa = 5.38YY115 pKa = 11.44VTTDD119 pKa = 3.83LRR121 pKa = 11.84TTDD124 pKa = 4.87DD125 pKa = 4.29YY126 pKa = 11.82VTTDD130 pKa = 3.01PGTTEE135 pKa = 5.66DD136 pKa = 5.15YY137 pKa = 8.6VTPDD141 pKa = 3.34PGTTDD146 pKa = 4.5DD147 pKa = 5.59YY148 pKa = 11.47VTTDD152 pKa = 3.01PGTTEE157 pKa = 5.4DD158 pKa = 5.17YY159 pKa = 9.97VTTDD163 pKa = 3.92LGTTDD168 pKa = 5.56DD169 pKa = 5.04YY170 pKa = 11.76VTTDD174 pKa = 3.01PGTTEE179 pKa = 5.43DD180 pKa = 4.57YY181 pKa = 8.14TTEE184 pKa = 4.73DD185 pKa = 4.34YY186 pKa = 10.2VTTDD190 pKa = 2.82PGTTEE195 pKa = 5.47DD196 pKa = 5.27YY197 pKa = 9.98VTTDD201 pKa = 2.82PGTTEE206 pKa = 5.47DD207 pKa = 4.63YY208 pKa = 9.16VTSDD212 pKa = 2.69RR213 pKa = 11.84GTTEE217 pKa = 5.32DD218 pKa = 4.41YY219 pKa = 9.28VTSDD223 pKa = 2.69RR224 pKa = 11.84GTTEE228 pKa = 5.27DD229 pKa = 5.4YY230 pKa = 10.0VTTDD234 pKa = 2.42QGTTEE239 pKa = 5.13DD240 pKa = 4.65YY241 pKa = 9.99VTTDD245 pKa = 3.95LEE247 pKa = 4.69TTAHH251 pKa = 6.38
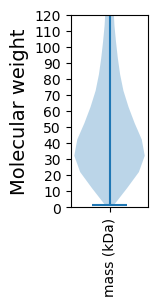
Molecular weight: 27.39 kDa
Isoelectric point according different methods:
Protein with the highest isoelectric point:
>tr|H0XLT0|H0XLT0_OTOGA Uncharacterized protein OS=Otolemur garnettii OX=30611 PE=4 SV=1
MM1 pKa = 7.1RR2 pKa = 11.84AKK4 pKa = 9.12WRR6 pKa = 11.84KK7 pKa = 9.1KK8 pKa = 9.32RR9 pKa = 11.84MRR11 pKa = 11.84RR12 pKa = 11.84LKK14 pKa = 10.08RR15 pKa = 11.84KK16 pKa = 8.21RR17 pKa = 11.84RR18 pKa = 11.84KK19 pKa = 8.46MRR21 pKa = 11.84QRR23 pKa = 11.84SKK25 pKa = 11.41
MM1 pKa = 7.1RR2 pKa = 11.84AKK4 pKa = 9.12WRR6 pKa = 11.84KK7 pKa = 9.1KK8 pKa = 9.32RR9 pKa = 11.84MRR11 pKa = 11.84RR12 pKa = 11.84LKK14 pKa = 10.08RR15 pKa = 11.84KK16 pKa = 8.21RR17 pKa = 11.84RR18 pKa = 11.84KK19 pKa = 8.46MRR21 pKa = 11.84QRR23 pKa = 11.84SKK25 pKa = 11.41
Molecular weight: 3.46 kDa
Isoelectric point according different methods:
Peptides (in silico digests for buttom-up proteomics)
Below you can find in silico digests of the whole proteome with Trypsin, Chymotrypsin, Trypsin+LysC, LysN, ArgC proteases suitable for different mass spec machines.| Try ESI |
 |
|---|
| ChTry ESI |
 |
|---|
| ArgC ESI |
 |
|---|
| LysN ESI |
 |
|---|
| TryLysC ESI |
 |
|---|
| Try MALDI |
 |
|---|
| ChTry MALDI |
 |
|---|
| ArgC MALDI |
 |
|---|
| LysN MALDI |
 |
|---|
| TryLysC MALDI |
 |
|---|
| Try LTQ |
 |
|---|
| ChTry LTQ |
 |
|---|
| ArgC LTQ |
 |
|---|
| LysN LTQ |
 |
|---|
| TryLysC LTQ |
 |
|---|
| Try MSlow |
 |
|---|
| ChTry MSlow |
 |
|---|
| ArgC MSlow |
 |
|---|
| LysN MSlow |
 |
|---|
| TryLysC MSlow |
 |
|---|
| Try MShigh |
 |
|---|
| ChTry MShigh |
 |
|---|
| ArgC MShigh |
 |
|---|
| LysN MShigh |
 |
|---|
| TryLysC MShigh |
 |
|---|
General Statistics
Number of major isoforms |
Number of additional isoforms |
Number of all proteins |
Number of amino acids |
Min. Seq. Length |
Max. Seq. Length |
Avg. Seq. Length |
Avg. Mol. Weight |
|---|---|---|---|---|---|---|---|
10768681 |
16 |
8779 |
540.3 |
60.28 |
Amino acid frequency
Ala |
Cys |
Asp |
Glu |
Phe |
Gly |
His |
Ile |
Lys |
Leu |
|---|---|---|---|---|---|---|---|---|---|
6.853 ± 0.017 | 2.291 ± 0.015 |
4.763 ± 0.013 | 6.994 ± 0.023 |
3.781 ± 0.013 | 6.49 ± 0.023 |
2.639 ± 0.009 | 4.463 ± 0.014 |
5.808 ± 0.022 | 10.089 ± 0.024 |
Met |
Asn |
Gln |
Pro |
Arg |
Ser |
Thr |
Val |
Trp |
Tyr |
|---|---|---|---|---|---|---|---|---|---|
2.14 ± 0.009 | 3.633 ± 0.012 |
6.128 ± 0.027 | 4.739 ± 0.015 |
5.56 ± 0.016 | 8.271 ± 0.022 |
5.316 ± 0.015 | 6.078 ± 0.013 |
1.212 ± 0.006 | 2.743 ± 0.011 |
Most of the basic statistics you can see at this page can be downloaded from this CSV file
Proteome-pI is available under Creative Commons Attribution-NoDerivs license, for more details see here
| Reference: Kozlowski LP. Proteome-pI 2.0: Proteome Isoelectric Point Database Update. Nucleic Acids Res. 2021, doi: 10.1093/nar/gkab944 | Contact: Lukasz P. Kozlowski |
