Vibrio sp. C7
Taxonomy: cellular organisms; Bacteria; Proteobacteria; Gammaproteobacteria; Vibrionales; Vibrionaceae; Vibrio; unclassified Vibrio
Average proteome isoelectric point is 6.14
Get precalculated fractions of proteins

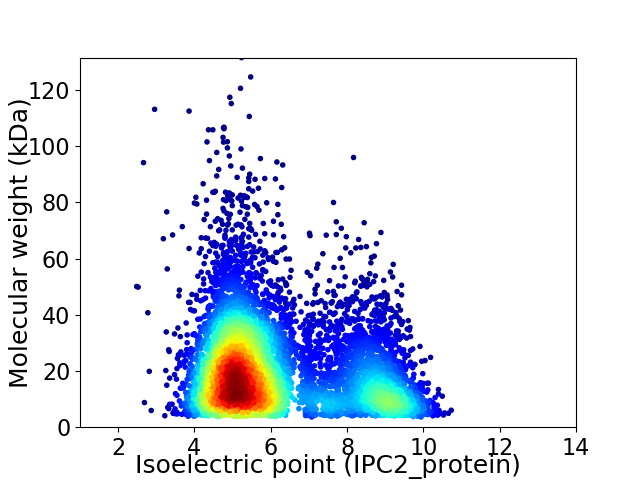
Virtual 2D-PAGE plot for 7458 proteins (isoelectric point calculated using IPC2_protein)
Get csv file with sequences according to given criteria:
* You can choose from 21 different methods for calculating isoelectric point
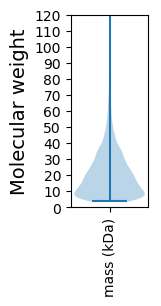
Summary statistics related to proteome-wise predictions


Protein with the lowest isoelectric point:
>tr|A0A090R0Z4|A0A090R0Z4_9VIBR Uncharacterized protein OS=Vibrio sp. C7 OX=1001886 GN=JCM19233_80 PE=4 SV=1
MM1 pKa = 7.67GDD3 pKa = 4.04IDD5 pKa = 4.05PTDD8 pKa = 4.85PIEE11 pKa = 4.49PPDD14 pKa = 4.11GGFEE18 pKa = 4.01PPPIGGDD25 pKa = 3.29NPLPPVDD32 pKa = 4.49INPPDD37 pKa = 4.75EE38 pKa = 5.22IPPQDD43 pKa = 3.78GTDD46 pKa = 3.55SAVLQAIQNQHH57 pKa = 6.16RR58 pKa = 11.84DD59 pKa = 3.36MNSALNHH66 pKa = 6.16ISSDD70 pKa = 3.84LNHH73 pKa = 6.76GFADD77 pKa = 3.56VNNNLRR83 pKa = 11.84SINNTNNAIGQTIVDD98 pKa = 4.14QMNQDD103 pKa = 3.55YY104 pKa = 10.64EE105 pKa = 4.27IYY107 pKa = 9.87QAQRR111 pKa = 11.84DD112 pKa = 3.9LTLQNTAATYY122 pKa = 11.4NMASTISGSIDD133 pKa = 3.35GQTDD137 pKa = 3.18NLLDD141 pKa = 3.89GLSNHH146 pKa = 6.12GQSIVGAIDD155 pKa = 3.49GLGEE159 pKa = 4.08SLEE162 pKa = 4.41GVGGCTPNEE171 pKa = 4.06EE172 pKa = 4.12NNYY175 pKa = 7.74TCEE178 pKa = 3.91GRR180 pKa = 11.84TGMDD184 pKa = 3.55SDD186 pKa = 4.86LVWDD190 pKa = 3.43ITGDD194 pKa = 3.05INTQVDD200 pKa = 3.97SEE202 pKa = 4.44YY203 pKa = 11.14SSAFGSVVSGAQSYY217 pKa = 11.01IDD219 pKa = 3.96GGQTDD224 pKa = 3.82EE225 pKa = 4.75MKK227 pKa = 11.06GVMDD231 pKa = 3.88SAIGVLFGGLPNIGSCTPFSLPMPNGNEE259 pKa = 3.7VSFGCEE265 pKa = 3.37FSDD268 pKa = 4.01KK269 pKa = 10.66FKK271 pKa = 11.24LIASWLIYY279 pKa = 10.08IYY281 pKa = 8.42TVWTLIDD288 pKa = 3.92LMLNGINPAQRR299 pKa = 11.84KK300 pKa = 7.44EE301 pKa = 4.02SS302 pKa = 3.55
MM1 pKa = 7.67GDD3 pKa = 4.04IDD5 pKa = 4.05PTDD8 pKa = 4.85PIEE11 pKa = 4.49PPDD14 pKa = 4.11GGFEE18 pKa = 4.01PPPIGGDD25 pKa = 3.29NPLPPVDD32 pKa = 4.49INPPDD37 pKa = 4.75EE38 pKa = 5.22IPPQDD43 pKa = 3.78GTDD46 pKa = 3.55SAVLQAIQNQHH57 pKa = 6.16RR58 pKa = 11.84DD59 pKa = 3.36MNSALNHH66 pKa = 6.16ISSDD70 pKa = 3.84LNHH73 pKa = 6.76GFADD77 pKa = 3.56VNNNLRR83 pKa = 11.84SINNTNNAIGQTIVDD98 pKa = 4.14QMNQDD103 pKa = 3.55YY104 pKa = 10.64EE105 pKa = 4.27IYY107 pKa = 9.87QAQRR111 pKa = 11.84DD112 pKa = 3.9LTLQNTAATYY122 pKa = 11.4NMASTISGSIDD133 pKa = 3.35GQTDD137 pKa = 3.18NLLDD141 pKa = 3.89GLSNHH146 pKa = 6.12GQSIVGAIDD155 pKa = 3.49GLGEE159 pKa = 4.08SLEE162 pKa = 4.41GVGGCTPNEE171 pKa = 4.06EE172 pKa = 4.12NNYY175 pKa = 7.74TCEE178 pKa = 3.91GRR180 pKa = 11.84TGMDD184 pKa = 3.55SDD186 pKa = 4.86LVWDD190 pKa = 3.43ITGDD194 pKa = 3.05INTQVDD200 pKa = 3.97SEE202 pKa = 4.44YY203 pKa = 11.14SSAFGSVVSGAQSYY217 pKa = 11.01IDD219 pKa = 3.96GGQTDD224 pKa = 3.82EE225 pKa = 4.75MKK227 pKa = 11.06GVMDD231 pKa = 3.88SAIGVLFGGLPNIGSCTPFSLPMPNGNEE259 pKa = 3.7VSFGCEE265 pKa = 3.37FSDD268 pKa = 4.01KK269 pKa = 10.66FKK271 pKa = 11.24LIASWLIYY279 pKa = 10.08IYY281 pKa = 8.42TVWTLIDD288 pKa = 3.92LMLNGINPAQRR299 pKa = 11.84KK300 pKa = 7.44EE301 pKa = 4.02SS302 pKa = 3.55
Molecular weight: 32.25 kDa
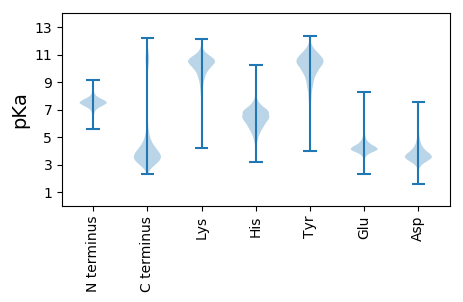
Isoelectric point according different methods:
Protein with the highest isoelectric point:
>tr|A0A090RC31|A0A090RC31_9VIBR Oxygen-insensitive NAD(P)H nitroreductase OS=Vibrio sp. C7 OX=1001886 GN=JCM19233_3038 PE=4 SV=1
MM1 pKa = 6.9QQTGTQQRR9 pKa = 11.84VRR11 pKa = 11.84ALLLSGIRR19 pKa = 11.84SAVLWRR25 pKa = 11.84QVGGKK30 pKa = 8.99RR31 pKa = 11.84RR32 pKa = 11.84HH33 pKa = 6.43LIFSRR38 pKa = 11.84KK39 pKa = 9.72KK40 pKa = 9.28MVEE43 pKa = 3.58QAQILLARR51 pKa = 11.84MM52 pKa = 3.83
MM1 pKa = 6.9QQTGTQQRR9 pKa = 11.84VRR11 pKa = 11.84ALLLSGIRR19 pKa = 11.84SAVLWRR25 pKa = 11.84QVGGKK30 pKa = 8.99RR31 pKa = 11.84RR32 pKa = 11.84HH33 pKa = 6.43LIFSRR38 pKa = 11.84KK39 pKa = 9.72KK40 pKa = 9.28MVEE43 pKa = 3.58QAQILLARR51 pKa = 11.84MM52 pKa = 3.83
Molecular weight: 6.05 kDa
Isoelectric point according different methods:
Peptides (in silico digests for buttom-up proteomics)
Below you can find in silico digests of the whole proteome with Trypsin, Chymotrypsin, Trypsin+LysC, LysN, ArgC proteases suitable for different mass spec machines.| Try ESI |
 |
|---|
| ChTry ESI |
 |
|---|
| ArgC ESI |
 |
|---|
| LysN ESI |
 |
|---|
| TryLysC ESI |
 |
|---|
| Try MALDI |
 |
|---|
| ChTry MALDI |
 |
|---|
| ArgC MALDI |
 |
|---|
| LysN MALDI |
 |
|---|
| TryLysC MALDI |
 |
|---|
| Try LTQ |
 |
|---|
| ChTry LTQ |
 |
|---|
| ArgC LTQ |
 |
|---|
| LysN LTQ |
 |
|---|
| TryLysC LTQ |
 |
|---|
| Try MSlow |
 |
|---|
| ChTry MSlow |
 |
|---|
| ArgC MSlow |
 |
|---|
| LysN MSlow |
 |
|---|
| TryLysC MSlow |
 |
|---|
| Try MShigh |
 |
|---|
| ChTry MShigh |
 |
|---|
| ArgC MShigh |
 |
|---|
| LysN MShigh |
 |
|---|
| TryLysC MShigh |
 |
|---|
General Statistics
Number of major isoforms |
Number of additional isoforms |
Number of all proteins |
Number of amino acids |
Min. Seq. Length |
Max. Seq. Length |
Avg. Seq. Length |
Avg. Mol. Weight |
|---|---|---|---|---|---|---|---|
0 |
1439835 |
37 |
1193 |
193.1 |
21.49 |
Amino acid frequency
Ala |
Cys |
Asp |
Glu |
Phe |
Gly |
His |
Ile |
Lys |
Leu |
|---|---|---|---|---|---|---|---|---|---|
8.388 ± 0.034 | 1.062 ± 0.011 |
5.54 ± 0.03 | 6.46 ± 0.028 |
4.124 ± 0.025 | 6.721 ± 0.03 |
2.245 ± 0.016 | 6.236 ± 0.026 |
5.077 ± 0.024 | 10.182 ± 0.034 |
Met |
Asn |
Gln |
Pro |
Arg |
Ser |
Thr |
Val |
Trp |
Tyr |
|---|---|---|---|---|---|---|---|---|---|
2.903 ± 0.017 | 4.212 ± 0.022 |
3.785 ± 0.02 | 4.536 ± 0.025 |
4.611 ± 0.023 | 6.901 ± 0.025 |
5.495 ± 0.025 | 7.185 ± 0.027 |
1.276 ± 0.013 | 3.061 ± 0.02 |
Most of the basic statistics you can see at this page can be downloaded from this CSV file
Proteome-pI is available under Creative Commons Attribution-NoDerivs license, for more details see here
| Reference: Kozlowski LP. Proteome-pI 2.0: Proteome Isoelectric Point Database Update. Nucleic Acids Res. 2021, doi: 10.1093/nar/gkab944 | Contact: Lukasz P. Kozlowski |
