Eilatimonas milleporae
Taxonomy: cellular organisms; Bacteria; Proteobacteria; Alphaproteobacteria; Kordiimonadales; Kordiimonadaceae; Eilatimonas
Average proteome isoelectric point is 6.28
Get precalculated fractions of proteins

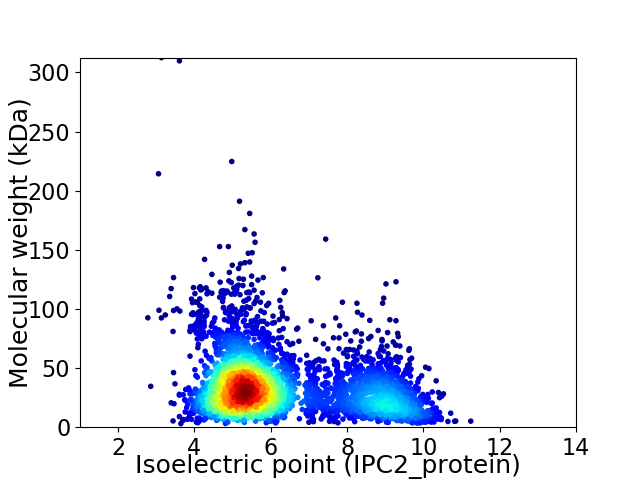
Virtual 2D-PAGE plot for 3747 proteins (isoelectric point calculated using IPC2_protein)
Get csv file with sequences according to given criteria:
* You can choose from 21 different methods for calculating isoelectric point
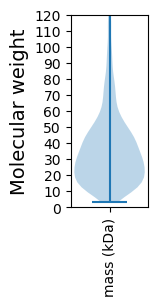
Summary statistics related to proteome-wise predictions


Protein with the lowest isoelectric point:
>tr|A0A3M0C5R8|A0A3M0C5R8_9PROT Dimethylaniline monooxygenase (N-oxide forming) OS=Eilatimonas milleporae OX=911205 GN=BXY39_2840 PE=3 SV=1
MM1 pKa = 7.63TGTSAQRR8 pKa = 11.84LVLYY12 pKa = 7.33TQNADD17 pKa = 3.67RR18 pKa = 11.84LSDD21 pKa = 3.79VVSTPITDD29 pKa = 4.93FIVTFIINTSEE40 pKa = 4.2DD41 pKa = 3.33PMTFTFSGGDD51 pKa = 3.39VSALKK56 pKa = 10.84SEE58 pKa = 4.44VEE60 pKa = 4.14AVQAAGKK67 pKa = 9.96RR68 pKa = 11.84VLISFGGGTMGSPNYY83 pKa = 9.71QPLVGHH89 pKa = 5.96EE90 pKa = 4.12TAVADD95 pKa = 3.65ALTRR99 pKa = 11.84FVAEE103 pKa = 4.76GGFDD107 pKa = 5.32GIDD110 pKa = 3.73LDD112 pKa = 4.9YY113 pKa = 11.3EE114 pKa = 4.35DD115 pKa = 5.0TGALAYY121 pKa = 10.1GDD123 pKa = 4.75PYY125 pKa = 11.39DD126 pKa = 3.94GVAFISDD133 pKa = 4.13LTNALAAAFQSTFPGQKK150 pKa = 9.94KK151 pKa = 10.45YY152 pKa = 8.78ITHH155 pKa = 7.28APQGPYY161 pKa = 9.73FVQGWNFAYY170 pKa = 10.25QQVLANTGDD179 pKa = 4.1AIDD182 pKa = 3.76YY183 pKa = 11.0LNIQFYY189 pKa = 10.78NNPGFEE195 pKa = 4.3GPSDD199 pKa = 3.45ILSCYY204 pKa = 9.13TDD206 pKa = 3.03WADD209 pKa = 3.71GANGQTPIDD218 pKa = 4.15PSRR221 pKa = 11.84MVIGLPVTAGDD232 pKa = 3.84AGSGYY237 pKa = 10.54VPLDD241 pKa = 3.46QIPPQIIAPVSKK253 pKa = 10.66AFPTFAGMMGWQFLSDD269 pKa = 4.05PQDD272 pKa = 2.96TWVDD276 pKa = 3.73TIGAALHH283 pKa = 5.87LQSATRR289 pKa = 11.84AAEE292 pKa = 3.77
MM1 pKa = 7.63TGTSAQRR8 pKa = 11.84LVLYY12 pKa = 7.33TQNADD17 pKa = 3.67RR18 pKa = 11.84LSDD21 pKa = 3.79VVSTPITDD29 pKa = 4.93FIVTFIINTSEE40 pKa = 4.2DD41 pKa = 3.33PMTFTFSGGDD51 pKa = 3.39VSALKK56 pKa = 10.84SEE58 pKa = 4.44VEE60 pKa = 4.14AVQAAGKK67 pKa = 9.96RR68 pKa = 11.84VLISFGGGTMGSPNYY83 pKa = 9.71QPLVGHH89 pKa = 5.96EE90 pKa = 4.12TAVADD95 pKa = 3.65ALTRR99 pKa = 11.84FVAEE103 pKa = 4.76GGFDD107 pKa = 5.32GIDD110 pKa = 3.73LDD112 pKa = 4.9YY113 pKa = 11.3EE114 pKa = 4.35DD115 pKa = 5.0TGALAYY121 pKa = 10.1GDD123 pKa = 4.75PYY125 pKa = 11.39DD126 pKa = 3.94GVAFISDD133 pKa = 4.13LTNALAAAFQSTFPGQKK150 pKa = 9.94KK151 pKa = 10.45YY152 pKa = 8.78ITHH155 pKa = 7.28APQGPYY161 pKa = 9.73FVQGWNFAYY170 pKa = 10.25QQVLANTGDD179 pKa = 4.1AIDD182 pKa = 3.76YY183 pKa = 11.0LNIQFYY189 pKa = 10.78NNPGFEE195 pKa = 4.3GPSDD199 pKa = 3.45ILSCYY204 pKa = 9.13TDD206 pKa = 3.03WADD209 pKa = 3.71GANGQTPIDD218 pKa = 4.15PSRR221 pKa = 11.84MVIGLPVTAGDD232 pKa = 3.84AGSGYY237 pKa = 10.54VPLDD241 pKa = 3.46QIPPQIIAPVSKK253 pKa = 10.66AFPTFAGMMGWQFLSDD269 pKa = 4.05PQDD272 pKa = 2.96TWVDD276 pKa = 3.73TIGAALHH283 pKa = 5.87LQSATRR289 pKa = 11.84AAEE292 pKa = 3.77
Molecular weight: 31.07 kDa
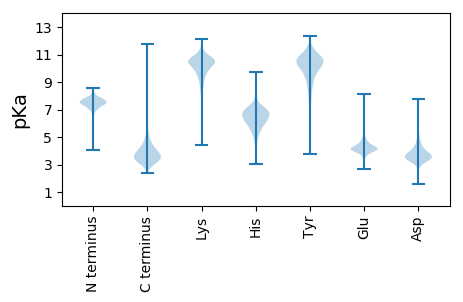
Isoelectric point according different methods:
Protein with the highest isoelectric point:
>tr|A0A3M0C9L4|A0A3M0C9L4_9PROT Uncharacterized protein OS=Eilatimonas milleporae OX=911205 GN=BXY39_2619 PE=4 SV=1
MM1 pKa = 7.45KK2 pKa = 9.51RR3 pKa = 11.84TFQPSVIVRR12 pKa = 11.84KK13 pKa = 9.41RR14 pKa = 11.84RR15 pKa = 11.84HH16 pKa = 4.55GFRR19 pKa = 11.84ARR21 pKa = 11.84MATVAGRR28 pKa = 11.84KK29 pKa = 8.81ILNARR34 pKa = 11.84RR35 pKa = 11.84GKK37 pKa = 9.77GRR39 pKa = 11.84KK40 pKa = 8.97RR41 pKa = 11.84LSAA44 pKa = 3.96
MM1 pKa = 7.45KK2 pKa = 9.51RR3 pKa = 11.84TFQPSVIVRR12 pKa = 11.84KK13 pKa = 9.41RR14 pKa = 11.84RR15 pKa = 11.84HH16 pKa = 4.55GFRR19 pKa = 11.84ARR21 pKa = 11.84MATVAGRR28 pKa = 11.84KK29 pKa = 8.81ILNARR34 pKa = 11.84RR35 pKa = 11.84GKK37 pKa = 9.77GRR39 pKa = 11.84KK40 pKa = 8.97RR41 pKa = 11.84LSAA44 pKa = 3.96
Molecular weight: 5.12 kDa
Isoelectric point according different methods:
Peptides (in silico digests for buttom-up proteomics)
Below you can find in silico digests of the whole proteome with Trypsin, Chymotrypsin, Trypsin+LysC, LysN, ArgC proteases suitable for different mass spec machines.| Try ESI |
 |
|---|
| ChTry ESI |
 |
|---|
| ArgC ESI |
 |
|---|
| LysN ESI |
 |
|---|
| TryLysC ESI |
 |
|---|
| Try MALDI |
 |
|---|
| ChTry MALDI |
 |
|---|
| ArgC MALDI |
 |
|---|
| LysN MALDI |
 |
|---|
| TryLysC MALDI |
 |
|---|
| Try LTQ |
 |
|---|
| ChTry LTQ |
 |
|---|
| ArgC LTQ |
 |
|---|
| LysN LTQ |
 |
|---|
| TryLysC LTQ |
 |
|---|
| Try MSlow |
 |
|---|
| ChTry MSlow |
 |
|---|
| ArgC MSlow |
 |
|---|
| LysN MSlow |
 |
|---|
| TryLysC MSlow |
 |
|---|
| Try MShigh |
 |
|---|
| ChTry MShigh |
 |
|---|
| ArgC MShigh |
 |
|---|
| LysN MShigh |
 |
|---|
| TryLysC MShigh |
 |
|---|
General Statistics
Number of major isoforms |
Number of additional isoforms |
Number of all proteins |
Number of amino acids |
Min. Seq. Length |
Max. Seq. Length |
Avg. Seq. Length |
Avg. Mol. Weight |
|---|---|---|---|---|---|---|---|
0 |
1277968 |
30 |
3164 |
341.1 |
37.03 |
Amino acid frequency
Ala |
Cys |
Asp |
Glu |
Phe |
Gly |
His |
Ile |
Lys |
Leu |
|---|---|---|---|---|---|---|---|---|---|
11.883 ± 0.056 | 0.815 ± 0.013 |
6.897 ± 0.044 | 5.282 ± 0.039 |
3.803 ± 0.029 | 8.9 ± 0.043 |
2.119 ± 0.02 | 4.957 ± 0.026 |
2.96 ± 0.034 | 9.914 ± 0.048 |
Met |
Asn |
Gln |
Pro |
Arg |
Ser |
Thr |
Val |
Trp |
Tyr |
|---|---|---|---|---|---|---|---|---|---|
2.455 ± 0.021 | 2.686 ± 0.034 |
5.098 ± 0.029 | 3.02 ± 0.023 |
7.262 ± 0.046 | 5.303 ± 0.03 |
5.899 ± 0.039 | 7.173 ± 0.032 |
1.259 ± 0.014 | 2.315 ± 0.019 |
Most of the basic statistics you can see at this page can be downloaded from this CSV file
Proteome-pI is available under Creative Commons Attribution-NoDerivs license, for more details see here
| Reference: Kozlowski LP. Proteome-pI 2.0: Proteome Isoelectric Point Database Update. Nucleic Acids Res. 2021, doi: 10.1093/nar/gkab944 | Contact: Lukasz P. Kozlowski |
