Sinimarinibacterium sp. CAU 1509
Taxonomy: cellular organisms; Bacteria; Proteobacteria; Gammaproteobacteria; Nevskiales; Sinobacteraceae; Sinimarinibacterium; unclassified Sinimarinibacterium
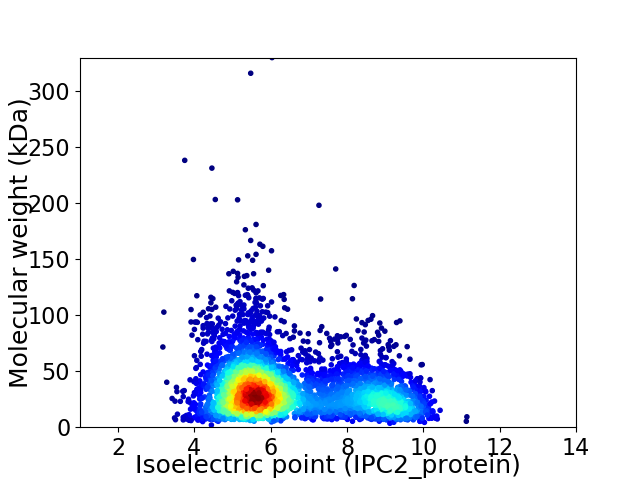
Average proteome isoelectric point is 6.5
Get precalculated fractions of proteins

Virtual 2D-PAGE plot for 4153 proteins (isoelectric point calculated using IPC2_protein)
Get csv file with sequences according to given criteria:
* You can choose from 21 different methods for calculating isoelectric point
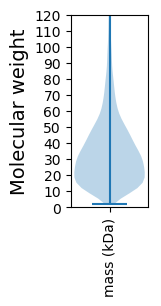
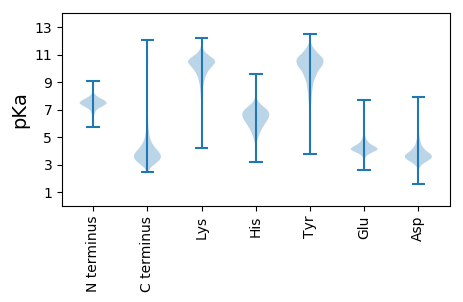
Summary statistics related to proteome-wise predictions


Protein with the lowest isoelectric point:
>tr|A0A4U0GVY4|A0A4U0GVY4_9GAMM OmpW family protein OS=Sinimarinibacterium sp. CAU 1509 OX=2562283 GN=E4T66_05870 PE=4 SV=1
MM1 pKa = 7.47KK2 pKa = 10.56NSLLLLSATLLLCACGGGDD21 pKa = 3.89SKK23 pKa = 11.38LHH25 pKa = 6.0EE26 pKa = 4.88SRR28 pKa = 11.84LSLSVTDD35 pKa = 4.77APVDD39 pKa = 3.4HH40 pKa = 7.4ADD42 pKa = 3.32AVVVSFISAEE52 pKa = 3.98LLDD55 pKa = 4.02ASGAVKK61 pKa = 10.3EE62 pKa = 4.7SFVLDD67 pKa = 3.76PPLQIDD73 pKa = 4.26LLSLQGANSAFLIDD87 pKa = 4.41DD88 pKa = 3.79AVVAPGVYY96 pKa = 9.44QEE98 pKa = 4.35VRR100 pKa = 11.84LKK102 pKa = 10.88VDD104 pKa = 4.17AEE106 pKa = 4.15NANCNAVSPPYY117 pKa = 10.51ASYY120 pKa = 9.41VTVDD124 pKa = 3.28GVDD127 pKa = 3.41YY128 pKa = 10.66PLIVPSGGSSGFKK141 pKa = 10.41VKK143 pKa = 10.68GPLTVAVGGSVAYY156 pKa = 9.32TIDD159 pKa = 3.3FDD161 pKa = 4.23LRR163 pKa = 11.84QSIAEE168 pKa = 4.23RR169 pKa = 11.84GATDD173 pKa = 4.5CYY175 pKa = 11.08NLKK178 pKa = 10.25PVLRR182 pKa = 11.84VVDD185 pKa = 3.77NATVGTLSGIIDD197 pKa = 4.18GSLLADD203 pKa = 4.08SSCTADD209 pKa = 3.16TATGAGAAVYY219 pKa = 9.15LFAGAGVTPDD229 pKa = 4.76DD230 pKa = 4.19VDD232 pKa = 3.51GTTPEE237 pKa = 4.48PLTSALLTATGNDD250 pKa = 3.12QFSYY254 pKa = 10.96EE255 pKa = 4.27VGFLPAGAYY264 pKa = 7.82TVALTCQAGDD274 pKa = 4.75DD275 pKa = 4.41DD276 pKa = 5.85PEE278 pKa = 5.21TDD280 pKa = 4.9DD281 pKa = 5.6PITFLRR287 pKa = 11.84SVDD290 pKa = 3.65VQVDD294 pKa = 3.43ADD296 pKa = 4.04SVTTQDD302 pKa = 3.14FTAPSLVVQGSS313 pKa = 3.27
MM1 pKa = 7.47KK2 pKa = 10.56NSLLLLSATLLLCACGGGDD21 pKa = 3.89SKK23 pKa = 11.38LHH25 pKa = 6.0EE26 pKa = 4.88SRR28 pKa = 11.84LSLSVTDD35 pKa = 4.77APVDD39 pKa = 3.4HH40 pKa = 7.4ADD42 pKa = 3.32AVVVSFISAEE52 pKa = 3.98LLDD55 pKa = 4.02ASGAVKK61 pKa = 10.3EE62 pKa = 4.7SFVLDD67 pKa = 3.76PPLQIDD73 pKa = 4.26LLSLQGANSAFLIDD87 pKa = 4.41DD88 pKa = 3.79AVVAPGVYY96 pKa = 9.44QEE98 pKa = 4.35VRR100 pKa = 11.84LKK102 pKa = 10.88VDD104 pKa = 4.17AEE106 pKa = 4.15NANCNAVSPPYY117 pKa = 10.51ASYY120 pKa = 9.41VTVDD124 pKa = 3.28GVDD127 pKa = 3.41YY128 pKa = 10.66PLIVPSGGSSGFKK141 pKa = 10.41VKK143 pKa = 10.68GPLTVAVGGSVAYY156 pKa = 9.32TIDD159 pKa = 3.3FDD161 pKa = 4.23LRR163 pKa = 11.84QSIAEE168 pKa = 4.23RR169 pKa = 11.84GATDD173 pKa = 4.5CYY175 pKa = 11.08NLKK178 pKa = 10.25PVLRR182 pKa = 11.84VVDD185 pKa = 3.77NATVGTLSGIIDD197 pKa = 4.18GSLLADD203 pKa = 4.08SSCTADD209 pKa = 3.16TATGAGAAVYY219 pKa = 9.15LFAGAGVTPDD229 pKa = 4.76DD230 pKa = 4.19VDD232 pKa = 3.51GTTPEE237 pKa = 4.48PLTSALLTATGNDD250 pKa = 3.12QFSYY254 pKa = 10.96EE255 pKa = 4.27VGFLPAGAYY264 pKa = 7.82TVALTCQAGDD274 pKa = 4.75DD275 pKa = 4.41DD276 pKa = 5.85PEE278 pKa = 5.21TDD280 pKa = 4.9DD281 pKa = 5.6PITFLRR287 pKa = 11.84SVDD290 pKa = 3.65VQVDD294 pKa = 3.43ADD296 pKa = 4.04SVTTQDD302 pKa = 3.14FTAPSLVVQGSS313 pKa = 3.27
Molecular weight: 32.05 kDa
Isoelectric point according different methods:
Protein with the highest isoelectric point:
>tr|A0A4U0GHX7|A0A4U0GHX7_9GAMM Nitrate reductase OS=Sinimarinibacterium sp. CAU 1509 OX=2562283 GN=E4T66_15880 PE=3 SV=1
MM1 pKa = 7.65RR2 pKa = 11.84RR3 pKa = 11.84RR4 pKa = 11.84PRR6 pKa = 11.84RR7 pKa = 11.84AWARR11 pKa = 11.84SRR13 pKa = 11.84APSPKK18 pKa = 9.1PKK20 pKa = 9.82PVLRR24 pKa = 11.84RR25 pKa = 11.84CRR27 pKa = 11.84RR28 pKa = 11.84RR29 pKa = 11.84SHH31 pKa = 6.68RR32 pKa = 11.84CASWRR37 pKa = 11.84RR38 pKa = 11.84APPKK42 pKa = 9.74RR43 pKa = 11.84RR44 pKa = 11.84RR45 pKa = 11.84RR46 pKa = 11.84PPRR49 pKa = 11.84AWPRR53 pKa = 11.84SKK55 pKa = 10.65RR56 pKa = 11.84RR57 pKa = 11.84LKK59 pKa = 10.55RR60 pKa = 11.84SRR62 pKa = 11.84QTMRR66 pKa = 11.84RR67 pKa = 11.84SQSGSTTTT75 pKa = 3.62
MM1 pKa = 7.65RR2 pKa = 11.84RR3 pKa = 11.84RR4 pKa = 11.84PRR6 pKa = 11.84RR7 pKa = 11.84AWARR11 pKa = 11.84SRR13 pKa = 11.84APSPKK18 pKa = 9.1PKK20 pKa = 9.82PVLRR24 pKa = 11.84RR25 pKa = 11.84CRR27 pKa = 11.84RR28 pKa = 11.84RR29 pKa = 11.84SHH31 pKa = 6.68RR32 pKa = 11.84CASWRR37 pKa = 11.84RR38 pKa = 11.84APPKK42 pKa = 9.74RR43 pKa = 11.84RR44 pKa = 11.84RR45 pKa = 11.84RR46 pKa = 11.84PPRR49 pKa = 11.84AWPRR53 pKa = 11.84SKK55 pKa = 10.65RR56 pKa = 11.84RR57 pKa = 11.84LKK59 pKa = 10.55RR60 pKa = 11.84SRR62 pKa = 11.84QTMRR66 pKa = 11.84RR67 pKa = 11.84SQSGSTTTT75 pKa = 3.62
Molecular weight: 9.26 kDa
Isoelectric point according different methods:
Peptides (in silico digests for buttom-up proteomics)
Below you can find in silico digests of the whole proteome with Trypsin, Chymotrypsin, Trypsin+LysC, LysN, ArgC proteases suitable for different mass spec machines.| Try ESI |
 |
|---|
| ChTry ESI |
 |
|---|
| ArgC ESI |
 |
|---|
| LysN ESI |
 |
|---|
| TryLysC ESI |
 |
|---|
| Try MALDI |
 |
|---|
| ChTry MALDI |
 |
|---|
| ArgC MALDI |
 |
|---|
| LysN MALDI |
 |
|---|
| TryLysC MALDI |
 |
|---|
| Try LTQ |
 |
|---|
| ChTry LTQ |
 |
|---|
| ArgC LTQ |
 |
|---|
| LysN LTQ |
 |
|---|
| TryLysC LTQ |
 |
|---|
| Try MSlow |
 |
|---|
| ChTry MSlow |
 |
|---|
| ArgC MSlow |
 |
|---|
| LysN MSlow |
 |
|---|
| TryLysC MSlow |
 |
|---|
| Try MShigh |
 |
|---|
| ChTry MShigh |
 |
|---|
| ArgC MShigh |
 |
|---|
| LysN MShigh |
 |
|---|
| TryLysC MShigh |
 |
|---|
General Statistics
Number of major isoforms |
Number of additional isoforms |
Number of all proteins |
Number of amino acids |
Min. Seq. Length |
Max. Seq. Length |
Avg. Seq. Length |
Avg. Mol. Weight |
|---|---|---|---|---|---|---|---|
0 |
1371815 |
18 |
2984 |
330.3 |
36.02 |
Amino acid frequency
Ala |
Cys |
Asp |
Glu |
Phe |
Gly |
His |
Ile |
Lys |
Leu |
|---|---|---|---|---|---|---|---|---|---|
12.13 ± 0.051 | 1.039 ± 0.013 |
5.836 ± 0.03 | 5.365 ± 0.034 |
3.439 ± 0.023 | 8.123 ± 0.033 |
2.265 ± 0.016 | 4.63 ± 0.027 |
2.794 ± 0.031 | 10.628 ± 0.048 |
Met |
Asn |
Gln |
Pro |
Arg |
Ser |
Thr |
Val |
Trp |
Tyr |
|---|---|---|---|---|---|---|---|---|---|
2.312 ± 0.017 | 2.611 ± 0.022 |
5.265 ± 0.033 | 3.965 ± 0.023 |
7.281 ± 0.04 | 5.707 ± 0.029 |
5.214 ± 0.028 | 7.425 ± 0.031 |
1.459 ± 0.016 | 2.513 ± 0.022 |
Most of the basic statistics you can see at this page can be downloaded from this CSV file
Proteome-pI is available under Creative Commons Attribution-NoDerivs license, for more details see here
| Reference: Kozlowski LP. Proteome-pI 2.0: Proteome Isoelectric Point Database Update. Nucleic Acids Res. 2021, doi: 10.1093/nar/gkab944 | Contact: Lukasz P. Kozlowski |
