Avibacterium endocarditidis
Taxonomy: cellular organisms; Bacteria; Proteobacteria; Gammaproteobacteria; Pasteurellales; Pasteurellaceae; Avibacterium
Average proteome isoelectric point is 6.53
Get precalculated fractions of proteins
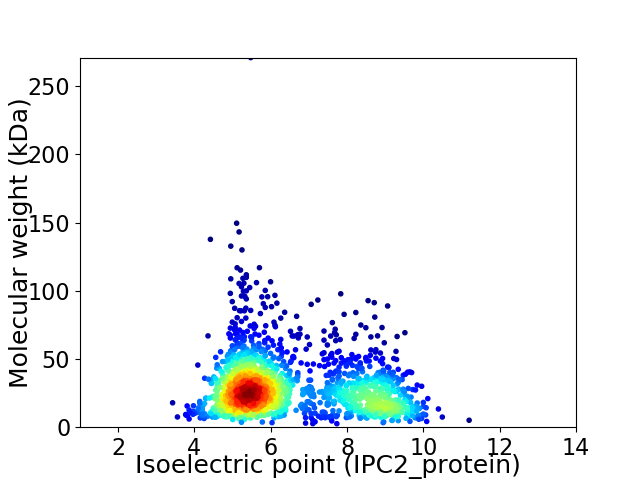
Virtual 2D-PAGE plot for 1713 proteins (isoelectric point calculated using IPC2_protein)
Get csv file with sequences according to given criteria:
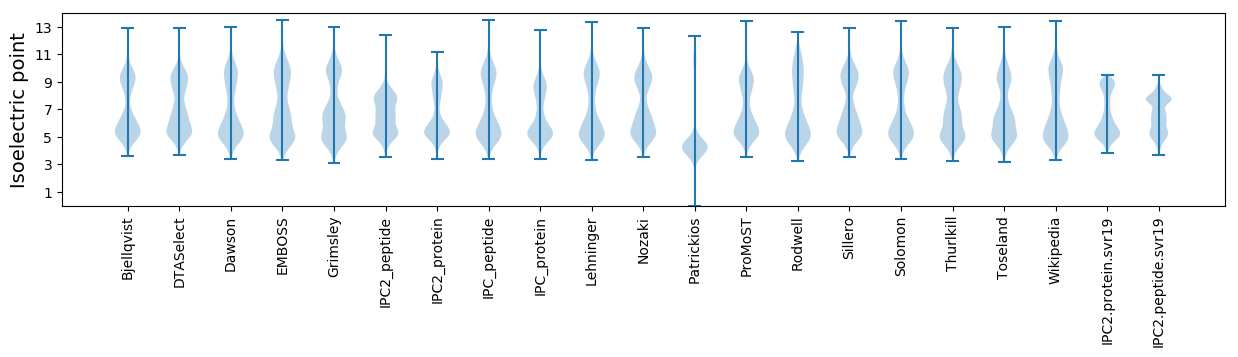
* You can choose from 21 different methods for calculating isoelectric point
Summary statistics related to proteome-wise predictions
Protein with the lowest isoelectric point:
>tr|A0A2S5AGJ4|A0A2S5AGJ4_9PAST 3-dehydroquinate synthase OS=Avibacterium endocarditidis OX=380674 GN=aroB PE=3 SV=1
MM1 pKa = 6.88ITSPEE6 pKa = 4.18DD7 pKa = 3.26NAQPLQLAQTEE18 pKa = 4.66LKK20 pKa = 10.88NGTTEE25 pKa = 4.1QVLLGWGFEE34 pKa = 4.36SHH36 pKa = 7.22TDD38 pKa = 3.77TEE40 pKa = 4.87WEE42 pKa = 4.86GSCWWLLSNAAEE54 pKa = 4.28EE55 pKa = 4.4NTLTTSAVQNSPNFSTALSFSSISAQLPAEE85 pKa = 4.78HH86 pKa = 6.6YY87 pKa = 10.53LQFGLDD93 pKa = 3.43IGNLSDD99 pKa = 3.53
MM1 pKa = 6.88ITSPEE6 pKa = 4.18DD7 pKa = 3.26NAQPLQLAQTEE18 pKa = 4.66LKK20 pKa = 10.88NGTTEE25 pKa = 4.1QVLLGWGFEE34 pKa = 4.36SHH36 pKa = 7.22TDD38 pKa = 3.77TEE40 pKa = 4.87WEE42 pKa = 4.86GSCWWLLSNAAEE54 pKa = 4.28EE55 pKa = 4.4NTLTTSAVQNSPNFSTALSFSSISAQLPAEE85 pKa = 4.78HH86 pKa = 6.6YY87 pKa = 10.53LQFGLDD93 pKa = 3.43IGNLSDD99 pKa = 3.53
Molecular weight: 10.83 kDa
Isoelectric point according different methods:
Protein with the highest isoelectric point:
>tr|A0A2S5AKI3|A0A2S5AKI3_9PAST PTS trehalose transporter subunit IIBC OS=Avibacterium endocarditidis OX=380674 GN=C3Z13_01265 PE=4 SV=1
MM1 pKa = 7.45KK2 pKa = 9.51RR3 pKa = 11.84TFQPSVLKK11 pKa = 10.6RR12 pKa = 11.84SRR14 pKa = 11.84THH16 pKa = 6.4GFRR19 pKa = 11.84ARR21 pKa = 11.84MATKK25 pKa = 10.4NGRR28 pKa = 11.84QVLARR33 pKa = 11.84RR34 pKa = 11.84RR35 pKa = 11.84AKK37 pKa = 10.15GRR39 pKa = 11.84KK40 pKa = 8.87SLSAA44 pKa = 3.86
MM1 pKa = 7.45KK2 pKa = 9.51RR3 pKa = 11.84TFQPSVLKK11 pKa = 10.6RR12 pKa = 11.84SRR14 pKa = 11.84THH16 pKa = 6.4GFRR19 pKa = 11.84ARR21 pKa = 11.84MATKK25 pKa = 10.4NGRR28 pKa = 11.84QVLARR33 pKa = 11.84RR34 pKa = 11.84RR35 pKa = 11.84AKK37 pKa = 10.15GRR39 pKa = 11.84KK40 pKa = 8.87SLSAA44 pKa = 3.86
Molecular weight: 5.1 kDa
Isoelectric point according different methods:
Peptides (in silico digests for buttom-up proteomics)
Below you can find in silico digests of the whole proteome with Trypsin, Chymotrypsin, Trypsin+LysC, LysN, ArgC proteases suitable for different mass spec machines.| Try ESI |
 |
|---|
| ChTry ESI |
|
|---|
| ArgC ESI |
|
|---|
| LysN ESI |
|
|---|
| TryLysC ESI |
|
|---|
| Try MALDI |
|
|---|
| ChTry MALDI |
|
|---|
| ArgC MALDI |
|
|---|
| LysN MALDI |
|
|---|
| TryLysC MALDI |
|
|---|
| Try LTQ |
|
|---|
| ChTry LTQ |
|
|---|
| ArgC LTQ |
|
|---|
| LysN LTQ |
|
|---|
| TryLysC LTQ |
|
|---|
| Try MSlow |
|
|---|
| ChTry MSlow |
|
|---|
| ArgC MSlow |
|
|---|
| LysN MSlow |
|
|---|
| TryLysC MSlow |
|
|---|
| Try MShigh |
|
|---|
| ChTry MShigh |
|
|---|
| ArgC MShigh |
|
|---|
| LysN MShigh |
|
|---|
| TryLysC MShigh |
|
|---|
General Statistics
Number of major isoforms |
Number of additional isoforms |
Number of all proteins |
Number of amino acids |
Min. Seq. Length |
Max. Seq. Length |
Avg. Seq. Length |
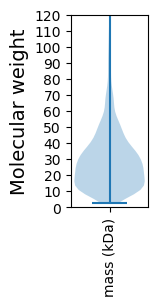
Avg. Mol. Weight |
|---|---|---|---|---|---|---|---|
0 |
465782 |
21 |
2405 |
271.9 |
30.37 |
Amino acid frequency
Ala |
Cys |
Asp |
Glu |
Phe |
Gly |
His |
Ile |
Lys |
Leu |
|---|---|---|---|---|---|---|---|---|---|
8.682 ± 0.063 | 1.063 ± 0.021 |
4.943 ± 0.045 | 6.232 ± 0.062 |
4.326 ± 0.047 | 6.733 ± 0.066 |
2.101 ± 0.031 | 6.743 ± 0.06 |
5.913 ± 0.047 | 10.593 ± 0.078 |
Met |
Asn |
Gln |
Pro |
Arg |
Ser |
Thr |
Val |
Trp |
Tyr |
|---|---|---|---|---|---|---|---|---|---|
2.439 ± 0.031 | 4.713 ± 0.038 |
3.945 ± 0.037 | 5.369 ± 0.073 |
4.453 ± 0.045 | 5.641 ± 0.044 |
5.084 ± 0.04 | 6.611 ± 0.061 |
1.21 ± 0.025 | 3.204 ± 0.039 |
Most of the basic statistics you can see at this page can be downloaded from this CSV file
See this proteome in:

Proteome-pI is available under Creative Commons Attribution-NoDerivs license, for more details see here
| Reference: Kozlowski LP. Proteome-pI 2.0: Proteome Isoelectric Point Database Update. Nucleic Acids Res. 2021, doi: 10.1093/nar/gkab944 | Contact: Lukasz P. Kozlowski |