Amylolactobacillus amylophilus DSM 20533 = JCM 1125
Taxonomy: cellular organisms; Bacteria; Terrabacteria group; Firmicutes; Bacilli; Lactobacillales; Lactobacillaceae; Amylolactobacillus; Amylolactobacillus amylophilus
Average proteome isoelectric point is 6.53
Get precalculated fractions of proteins

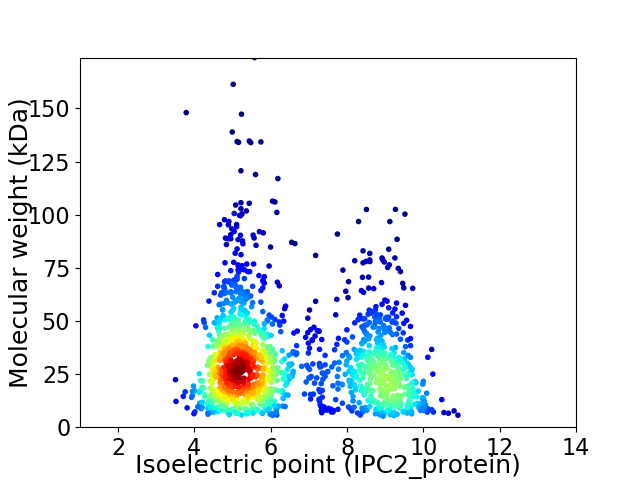
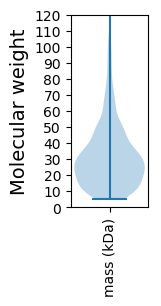
Virtual 2D-PAGE plot for 1532 proteins (isoelectric point calculated using IPC2_protein)
Get csv file with sequences according to given criteria:
* You can choose from 21 different methods for calculating isoelectric point
Summary statistics related to proteome-wise predictions


Protein with the lowest isoelectric point:
>tr|A0A0R1YJW0|A0A0R1YJW0_9LACO Bac_transf domain-containing protein OS=Amylolactobacillus amylophilus DSM 20533 = JCM 1125 OX=1423721 GN=FD40_GL000441 PE=3 SV=1
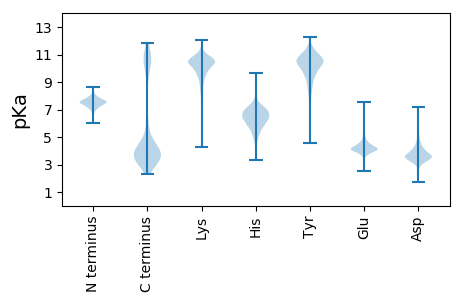
MM1 pKa = 6.1TTAKK5 pKa = 9.67IVYY8 pKa = 10.54ASMTGNNEE16 pKa = 3.8EE17 pKa = 4.18IANILDD23 pKa = 3.6EE24 pKa = 4.55EE25 pKa = 4.4LTDD28 pKa = 4.14RR29 pKa = 11.84GVTTSLSDD37 pKa = 3.35ISFTPASEE45 pKa = 3.99YY46 pKa = 11.19LNYY49 pKa = 10.68DD50 pKa = 3.36LTLMVVYY57 pKa = 9.06TYY59 pKa = 11.57GEE61 pKa = 4.21GEE63 pKa = 4.41MPDD66 pKa = 3.81EE67 pKa = 4.44VADD70 pKa = 4.76FYY72 pKa = 11.91DD73 pKa = 5.4DD74 pKa = 4.86LAEE77 pKa = 4.88LDD79 pKa = 3.93LTGKK83 pKa = 10.28VYY85 pKa = 11.08AVMGSGDD92 pKa = 3.8LFYY95 pKa = 11.06EE96 pKa = 3.83EE97 pKa = 5.72HH98 pKa = 6.15YY99 pKa = 10.9CEE101 pKa = 4.01TVDD104 pKa = 4.44YY105 pKa = 10.89FEE107 pKa = 5.34QLFTKK112 pKa = 10.5IGATKK117 pKa = 10.09GAEE120 pKa = 3.75PLKK123 pKa = 10.85INLEE127 pKa = 3.95ADD129 pKa = 3.53EE130 pKa = 6.51ADD132 pKa = 3.73MDD134 pKa = 4.73NIAAVADD141 pKa = 3.88SVLAKK146 pKa = 10.67LNEE149 pKa = 4.17KK150 pKa = 10.28AA151 pKa = 4.25
MM1 pKa = 6.1TTAKK5 pKa = 9.67IVYY8 pKa = 10.54ASMTGNNEE16 pKa = 3.8EE17 pKa = 4.18IANILDD23 pKa = 3.6EE24 pKa = 4.55EE25 pKa = 4.4LTDD28 pKa = 4.14RR29 pKa = 11.84GVTTSLSDD37 pKa = 3.35ISFTPASEE45 pKa = 3.99YY46 pKa = 11.19LNYY49 pKa = 10.68DD50 pKa = 3.36LTLMVVYY57 pKa = 9.06TYY59 pKa = 11.57GEE61 pKa = 4.21GEE63 pKa = 4.41MPDD66 pKa = 3.81EE67 pKa = 4.44VADD70 pKa = 4.76FYY72 pKa = 11.91DD73 pKa = 5.4DD74 pKa = 4.86LAEE77 pKa = 4.88LDD79 pKa = 3.93LTGKK83 pKa = 10.28VYY85 pKa = 11.08AVMGSGDD92 pKa = 3.8LFYY95 pKa = 11.06EE96 pKa = 3.83EE97 pKa = 5.72HH98 pKa = 6.15YY99 pKa = 10.9CEE101 pKa = 4.01TVDD104 pKa = 4.44YY105 pKa = 10.89FEE107 pKa = 5.34QLFTKK112 pKa = 10.5IGATKK117 pKa = 10.09GAEE120 pKa = 3.75PLKK123 pKa = 10.85INLEE127 pKa = 3.95ADD129 pKa = 3.53EE130 pKa = 6.51ADD132 pKa = 3.73MDD134 pKa = 4.73NIAAVADD141 pKa = 3.88SVLAKK146 pKa = 10.67LNEE149 pKa = 4.17KK150 pKa = 10.28AA151 pKa = 4.25
Molecular weight: 16.66 kDa
Isoelectric point according different methods:
Protein with the highest isoelectric point:
>tr|A0A0R1YNW8|A0A0R1YNW8_9LACO Cell wall-associated glycoside hydrolase (NLP P60 protein) OS=Amylolactobacillus amylophilus DSM 20533 = JCM 1125 OX=1423721 GN=FD40_GL001316 PE=3 SV=1
MM1 pKa = 6.05TTKK4 pKa = 9.88RR5 pKa = 11.84TYY7 pKa = 9.64QPKK10 pKa = 8.58KK11 pKa = 7.47RR12 pKa = 11.84HH13 pKa = 5.71RR14 pKa = 11.84EE15 pKa = 3.79RR16 pKa = 11.84VHH18 pKa = 7.7GFMKK22 pKa = 10.56RR23 pKa = 11.84MSTKK27 pKa = 9.52NGRR30 pKa = 11.84RR31 pKa = 11.84VLARR35 pKa = 11.84RR36 pKa = 11.84RR37 pKa = 11.84RR38 pKa = 11.84KK39 pKa = 9.05GRR41 pKa = 11.84KK42 pKa = 8.7VLSAA46 pKa = 4.05
MM1 pKa = 6.05TTKK4 pKa = 9.88RR5 pKa = 11.84TYY7 pKa = 9.64QPKK10 pKa = 8.58KK11 pKa = 7.47RR12 pKa = 11.84HH13 pKa = 5.71RR14 pKa = 11.84EE15 pKa = 3.79RR16 pKa = 11.84VHH18 pKa = 7.7GFMKK22 pKa = 10.56RR23 pKa = 11.84MSTKK27 pKa = 9.52NGRR30 pKa = 11.84RR31 pKa = 11.84VLARR35 pKa = 11.84RR36 pKa = 11.84RR37 pKa = 11.84RR38 pKa = 11.84KK39 pKa = 9.05GRR41 pKa = 11.84KK42 pKa = 8.7VLSAA46 pKa = 4.05
Molecular weight: 5.65 kDa
Isoelectric point according different methods:
Peptides (in silico digests for buttom-up proteomics)
Below you can find in silico digests of the whole proteome with Trypsin, Chymotrypsin, Trypsin+LysC, LysN, ArgC proteases suitable for different mass spec machines.| Try ESI |
 |
|---|
| ChTry ESI |
 |
|---|
| ArgC ESI |
 |
|---|
| LysN ESI |
 |
|---|
| TryLysC ESI |
 |
|---|
| Try MALDI |
 |
|---|
| ChTry MALDI |
 |
|---|
| ArgC MALDI |
 |
|---|
| LysN MALDI |
 |
|---|
| TryLysC MALDI |
 |
|---|
| Try LTQ |
 |
|---|
| ChTry LTQ |
 |
|---|
| ArgC LTQ |
 |
|---|
| LysN LTQ |
 |
|---|
| TryLysC LTQ |
 |
|---|
| Try MSlow |
 |
|---|
| ChTry MSlow |
 |
|---|
| ArgC MSlow |
 |
|---|
| LysN MSlow |
 |
|---|
| TryLysC MSlow |
 |
|---|
| Try MShigh |
 |
|---|
| ChTry MShigh |
 |
|---|
| ArgC MShigh |
 |
|---|
| LysN MShigh |
 |
|---|
| TryLysC MShigh |
 |
|---|
General Statistics
Number of major isoforms |
Number of additional isoforms |
Number of all proteins |
Number of amino acids |
Min. Seq. Length |
Max. Seq. Length |
Avg. Seq. Length |
Avg. Mol. Weight |
|---|---|---|---|---|---|---|---|
0 |
452247 |
46 |
1524 |
295.2 |
33.02 |
Amino acid frequency
Ala |
Cys |
Asp |
Glu |
Phe |
Gly |
His |
Ile |
Lys |
Leu |
|---|---|---|---|---|---|---|---|---|---|
7.807 ± 0.054 | 0.325 ± 0.012 |
5.705 ± 0.059 | 6.167 ± 0.068 |
4.494 ± 0.049 | 6.485 ± 0.059 |
1.949 ± 0.028 | 7.367 ± 0.066 |
6.492 ± 0.059 | 9.921 ± 0.079 |
Met |
Asn |
Gln |
Pro |
Arg |
Ser |
Thr |
Val |
Trp |
Tyr |
|---|---|---|---|---|---|---|---|---|---|
2.521 ± 0.03 | 5.014 ± 0.046 |
3.486 ± 0.034 | 4.493 ± 0.047 |
4.172 ± 0.046 | 5.802 ± 0.049 |
6.149 ± 0.046 | 7.271 ± 0.049 |
0.869 ± 0.02 | 3.513 ± 0.037 |
Most of the basic statistics you can see at this page can be downloaded from this CSV file
Proteome-pI is available under Creative Commons Attribution-NoDerivs license, for more details see here
| Reference: Kozlowski LP. Proteome-pI 2.0: Proteome Isoelectric Point Database Update. Nucleic Acids Res. 2021, doi: 10.1093/nar/gkab944 | Contact: Lukasz P. Kozlowski |
