Vibrio phage vB_VchM-138
Taxonomy: Viruses; Duplodnaviria; Heunggongvirae; Uroviricota; Caudoviricetes; Caudovirales; Myoviridae; unclassified Myoviridae
Average proteome isoelectric point is 6.15
Get precalculated fractions of proteins
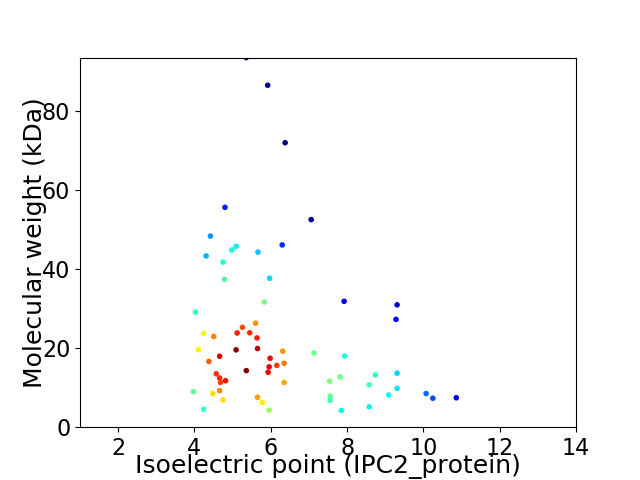
Virtual 2D-PAGE plot for 67 proteins (isoelectric point calculated using IPC2_protein)
Get csv file with sequences according to given criteria:
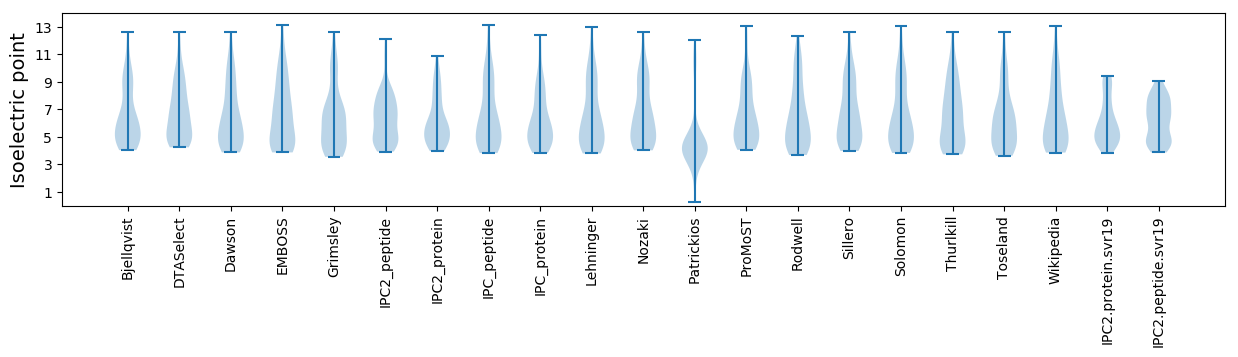
* You can choose from 21 different methods for calculating isoelectric point
Summary statistics related to proteome-wise predictions
Protein with the lowest isoelectric point:
>tr|H9C150|H9C150_9CAUD Uncharacterized protein OS=Vibrio phage vB_VchM-138 OX=1127518 GN=VchM-138_0067 PE=4 SV=1
MM1 pKa = 7.68IDD3 pKa = 3.45VLFVALVAVAIYY15 pKa = 10.87NPTLTLWILVSMVVVSDD32 pKa = 3.93ALFGAVDD39 pKa = 3.48GWVYY43 pKa = 10.46FGLMALIDD51 pKa = 4.3LLCDD55 pKa = 5.2RR56 pKa = 11.84ITPHH60 pKa = 5.44NWGVIIIQDD69 pKa = 4.03PFPYY73 pKa = 9.86EE74 pKa = 4.21CNRR77 pKa = 11.84GLSTT81 pKa = 4.63
MM1 pKa = 7.68IDD3 pKa = 3.45VLFVALVAVAIYY15 pKa = 10.87NPTLTLWILVSMVVVSDD32 pKa = 3.93ALFGAVDD39 pKa = 3.48GWVYY43 pKa = 10.46FGLMALIDD51 pKa = 4.3LLCDD55 pKa = 5.2RR56 pKa = 11.84ITPHH60 pKa = 5.44NWGVIIIQDD69 pKa = 4.03PFPYY73 pKa = 9.86EE74 pKa = 4.21CNRR77 pKa = 11.84GLSTT81 pKa = 4.63
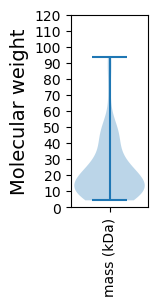
Molecular weight: 9.0 kDa
Isoelectric point according different methods:
Protein with the highest isoelectric point:
>tr|H9C0Y8|H9C0Y8_9CAUD Uncharacterized protein OS=Vibrio phage vB_VchM-138 OX=1127518 GN=VchM-138_0005 PE=4 SV=1
MM1 pKa = 7.1FQRR4 pKa = 11.84IIASLMAQANHH15 pKa = 5.95TAANSIGNQLARR27 pKa = 11.84PVSDD31 pKa = 3.6NAWGNRR37 pKa = 11.84KK38 pKa = 9.46GGRR41 pKa = 11.84KK42 pKa = 7.17QAHH45 pKa = 6.34RR46 pKa = 11.84FSGVAAQRR54 pKa = 11.84RR55 pKa = 11.84AARR58 pKa = 11.84KK59 pKa = 8.91IRR61 pKa = 11.84NQRR64 pKa = 11.84KK65 pKa = 9.16SKK67 pKa = 10.81
MM1 pKa = 7.1FQRR4 pKa = 11.84IIASLMAQANHH15 pKa = 5.95TAANSIGNQLARR27 pKa = 11.84PVSDD31 pKa = 3.6NAWGNRR37 pKa = 11.84KK38 pKa = 9.46GGRR41 pKa = 11.84KK42 pKa = 7.17QAHH45 pKa = 6.34RR46 pKa = 11.84FSGVAAQRR54 pKa = 11.84RR55 pKa = 11.84AARR58 pKa = 11.84KK59 pKa = 8.91IRR61 pKa = 11.84NQRR64 pKa = 11.84KK65 pKa = 9.16SKK67 pKa = 10.81
Molecular weight: 7.46 kDa
Isoelectric point according different methods:
Peptides (in silico digests for buttom-up proteomics)
Below you can find in silico digests of the whole proteome with Trypsin, Chymotrypsin, Trypsin+LysC, LysN, ArgC proteases suitable for different mass spec machines.| Try ESI |
 |
|---|
| ChTry ESI |
|
|---|
| ArgC ESI |
|
|---|
| LysN ESI |
|
|---|
| TryLysC ESI |
|
|---|
| Try MALDI |
|
|---|
| ChTry MALDI |
|
|---|
| ArgC MALDI |
|
|---|
| LysN MALDI |
|
|---|
| TryLysC MALDI |
|
|---|
| Try LTQ |
|
|---|
| ChTry LTQ |
|
|---|
| ArgC LTQ |
|
|---|
| LysN LTQ |
|
|---|
| TryLysC LTQ |
|
|---|
| Try MSlow |
|
|---|
| ChTry MSlow |
|
|---|
| ArgC MSlow |
|
|---|
| LysN MSlow |
|
|---|
| TryLysC MSlow |
|
|---|
| Try MShigh |
|
|---|
| ChTry MShigh |
|
|---|
| ArgC MShigh |
|
|---|
| LysN MShigh |
|
|---|
| TryLysC MShigh |
|
|---|
General Statistics
Number of major isoforms |
Number of additional isoforms |
Number of all proteins |
Number of amino acids |
Min. Seq. Length |
Max. Seq. Length |
Avg. Seq. Length |
Avg. Mol. Weight |
|---|---|---|---|---|---|---|---|
0 |
13960 |
39 |
826 |
208.4 |
23.24 |
Amino acid frequency
Ala |
Cys |
Asp |
Glu |
Phe |
Gly |
His |
Ile |
Lys |
Leu |
|---|---|---|---|---|---|---|---|---|---|
7.865 ± 0.289 | 1.34 ± 0.139 |
6.862 ± 0.189 | 5.487 ± 0.186 |
3.632 ± 0.224 | 7.092 ± 0.259 |
1.819 ± 0.156 | 6.533 ± 0.266 |
5.143 ± 0.236 | 7.615 ± 0.251 |
Met |
Asn |
Gln |
Pro |
Arg |
Ser |
Thr |
Val |
Trp |
Tyr |
|---|---|---|---|---|---|---|---|---|---|
2.6 ± 0.129 | 5.365 ± 0.244 |
4.42 ± 0.324 | 3.797 ± 0.213 |
5.745 ± 0.25 | 6.304 ± 0.211 |
6.533 ± 0.261 | 6.884 ± 0.244 |
1.418 ± 0.116 | 3.546 ± 0.204 |
Most of the basic statistics you can see at this page can be downloaded from this CSV file
See this proteome in:

Proteome-pI is available under Creative Commons Attribution-NoDerivs license, for more details see here
| Reference: Kozlowski LP. Proteome-pI 2.0: Proteome Isoelectric Point Database Update. Nucleic Acids Res. 2021, doi: 10.1093/nar/gkab944 | Contact: Lukasz P. Kozlowski |