Circovirus-like genome DCCV-8
Taxonomy: Viruses; Monodnaviria; Shotokuvirae; Cressdnaviricota; Arfiviricetes; Cirlivirales; Circoviridae; unclassified Circoviridae
Average proteome isoelectric point is 8.36
Get precalculated fractions of proteins

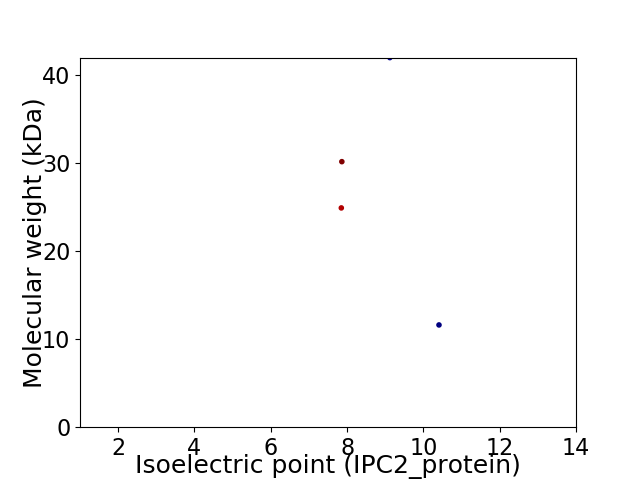
Virtual 2D-PAGE plot for 4 proteins (isoelectric point calculated using IPC2_protein)
Get csv file with sequences according to given criteria:
* You can choose from 21 different methods for calculating isoelectric point
Summary statistics related to proteome-wise predictions


Protein with the lowest isoelectric point:
>tr|A0A190WHD6|A0A190WHD6_9CIRC Uncharacterized protein OS=Circovirus-like genome DCCV-8 OX=1788448 PE=4 SV=1
MM1 pKa = 7.54EE2 pKa = 5.86CDD4 pKa = 3.65KK5 pKa = 11.14RR6 pKa = 11.84DD7 pKa = 3.57TGSALSPEE15 pKa = 4.49TLGHH19 pKa = 6.53LNCPTEE25 pKa = 3.91LHH27 pKa = 6.3GVSDD31 pKa = 4.04SQSVEE36 pKa = 3.89NQDD39 pKa = 3.31ISTGKK44 pKa = 8.99YY45 pKa = 6.74WCPSPPRR52 pKa = 11.84KK53 pKa = 9.25PLPKK57 pKa = 10.17SKK59 pKa = 10.65LPSDD63 pKa = 4.16YY64 pKa = 9.96KK65 pKa = 11.33GCMLKK70 pKa = 10.55PPVPLLPRR78 pKa = 11.84LTCIKK83 pKa = 10.32KK84 pKa = 10.3KK85 pKa = 10.98LEE87 pKa = 4.08TEE89 pKa = 4.28TPSNSDD95 pKa = 3.27QEE97 pKa = 4.26QSTGIMQLTGTEE109 pKa = 4.05LKK111 pKa = 10.03SWRR114 pKa = 11.84KK115 pKa = 8.55QVTSIWSQRR124 pKa = 11.84TFTFVIIAPLLQLQAIMKK142 pKa = 9.74SLSEE146 pKa = 3.99LRR148 pKa = 11.84KK149 pKa = 8.69MSSFFMAEE157 pKa = 3.82QVRR160 pKa = 11.84EE161 pKa = 4.2SLGEE165 pKa = 3.89RR166 pKa = 11.84GKK168 pKa = 11.0KK169 pKa = 9.12PDD171 pKa = 3.47QVPILKK177 pKa = 9.53IHH179 pKa = 6.52AANFGVATALTNMLLSMNLEE199 pKa = 4.32VVSISPTCCDD209 pKa = 2.7GWIGIQSALRR219 pKa = 11.84SKK221 pKa = 10.82GAADD225 pKa = 3.54PP226 pKa = 4.33
MM1 pKa = 7.54EE2 pKa = 5.86CDD4 pKa = 3.65KK5 pKa = 11.14RR6 pKa = 11.84DD7 pKa = 3.57TGSALSPEE15 pKa = 4.49TLGHH19 pKa = 6.53LNCPTEE25 pKa = 3.91LHH27 pKa = 6.3GVSDD31 pKa = 4.04SQSVEE36 pKa = 3.89NQDD39 pKa = 3.31ISTGKK44 pKa = 8.99YY45 pKa = 6.74WCPSPPRR52 pKa = 11.84KK53 pKa = 9.25PLPKK57 pKa = 10.17SKK59 pKa = 10.65LPSDD63 pKa = 4.16YY64 pKa = 9.96KK65 pKa = 11.33GCMLKK70 pKa = 10.55PPVPLLPRR78 pKa = 11.84LTCIKK83 pKa = 10.32KK84 pKa = 10.3KK85 pKa = 10.98LEE87 pKa = 4.08TEE89 pKa = 4.28TPSNSDD95 pKa = 3.27QEE97 pKa = 4.26QSTGIMQLTGTEE109 pKa = 4.05LKK111 pKa = 10.03SWRR114 pKa = 11.84KK115 pKa = 8.55QVTSIWSQRR124 pKa = 11.84TFTFVIIAPLLQLQAIMKK142 pKa = 9.74SLSEE146 pKa = 3.99LRR148 pKa = 11.84KK149 pKa = 8.69MSSFFMAEE157 pKa = 3.82QVRR160 pKa = 11.84EE161 pKa = 4.2SLGEE165 pKa = 3.89RR166 pKa = 11.84GKK168 pKa = 11.0KK169 pKa = 9.12PDD171 pKa = 3.47QVPILKK177 pKa = 9.53IHH179 pKa = 6.52AANFGVATALTNMLLSMNLEE199 pKa = 4.32VVSISPTCCDD209 pKa = 2.7GWIGIQSALRR219 pKa = 11.84SKK221 pKa = 10.82GAADD225 pKa = 3.54PP226 pKa = 4.33
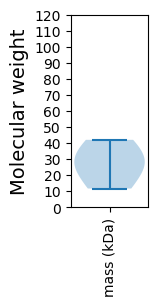
Molecular weight: 24.9 kDa
Isoelectric point according different methods:
Protein with the highest isoelectric point:
>tr|A0A190WHK4|A0A190WHK4_9CIRC Replication-associated protein OS=Circovirus-like genome DCCV-8 OX=1788448 PE=4 SV=1
MM1 pKa = 7.36SVTVTKK7 pKa = 10.56IAGDD11 pKa = 3.77YY12 pKa = 10.5INRR15 pKa = 11.84SMGNNPYY22 pKa = 10.8AFAYY26 pKa = 10.23RR27 pKa = 11.84GAALGKK33 pKa = 10.01RR34 pKa = 11.84YY35 pKa = 10.05SDD37 pKa = 2.88WVVRR41 pKa = 11.84MGKK44 pKa = 9.82KK45 pKa = 9.89SSSKK49 pKa = 10.07RR50 pKa = 11.84SYY52 pKa = 8.91RR53 pKa = 11.84TNFSMPGKK61 pKa = 10.16VGSAPSGGYY70 pKa = 9.7GSAPGRR76 pKa = 11.84VTGSAPQKK84 pKa = 10.27ALLMLSEE91 pKa = 4.8LPSTSVHH98 pKa = 5.81RR99 pKa = 11.84RR100 pKa = 11.84RR101 pKa = 11.84NSKK104 pKa = 9.73IYY106 pKa = 10.23KK107 pKa = 9.58
MM1 pKa = 7.36SVTVTKK7 pKa = 10.56IAGDD11 pKa = 3.77YY12 pKa = 10.5INRR15 pKa = 11.84SMGNNPYY22 pKa = 10.8AFAYY26 pKa = 10.23RR27 pKa = 11.84GAALGKK33 pKa = 10.01RR34 pKa = 11.84YY35 pKa = 10.05SDD37 pKa = 2.88WVVRR41 pKa = 11.84MGKK44 pKa = 9.82KK45 pKa = 9.89SSSKK49 pKa = 10.07RR50 pKa = 11.84SYY52 pKa = 8.91RR53 pKa = 11.84TNFSMPGKK61 pKa = 10.16VGSAPSGGYY70 pKa = 9.7GSAPGRR76 pKa = 11.84VTGSAPQKK84 pKa = 10.27ALLMLSEE91 pKa = 4.8LPSTSVHH98 pKa = 5.81RR99 pKa = 11.84RR100 pKa = 11.84RR101 pKa = 11.84NSKK104 pKa = 9.73IYY106 pKa = 10.23KK107 pKa = 9.58
Molecular weight: 11.61 kDa
Isoelectric point according different methods:
Peptides (in silico digests for buttom-up proteomics)
Below you can find in silico digests of the whole proteome with Trypsin, Chymotrypsin, Trypsin+LysC, LysN, ArgC proteases suitable for different mass spec machines.| Try ESI |
 |
|---|
| ChTry ESI |
 |
|---|
| ArgC ESI |
 |
|---|
| LysN ESI |
 |
|---|
| TryLysC ESI |
 |
|---|
| Try MALDI |
 |
|---|
| ChTry MALDI |
 |
|---|
| ArgC MALDI |
 |
|---|
| LysN MALDI |
 |
|---|
| TryLysC MALDI |
 |
|---|
| Try LTQ |
 |
|---|
| ChTry LTQ |
 |
|---|
| ArgC LTQ |
 |
|---|
| LysN LTQ |
 |
|---|
| TryLysC LTQ |
 |
|---|
| Try MSlow |
 |
|---|
| ChTry MSlow |
 |
|---|
| ArgC MSlow |
 |
|---|
| LysN MSlow |
 |
|---|
| TryLysC MSlow |
 |
|---|
| Try MShigh |
 |
|---|
| ChTry MShigh |
 |
|---|
| ArgC MShigh |
 |
|---|
| LysN MShigh |
 |
|---|
| TryLysC MShigh |
 |
|---|
General Statistics
Number of major isoforms |
Number of additional isoforms |
Number of all proteins |
Number of amino acids |
Min. Seq. Length |
Max. Seq. Length |
Avg. Seq. Length |
Avg. Mol. Weight |
|---|---|---|---|---|---|---|---|
0 |
971 |
107 |
375 |
242.8 |
27.16 |
Amino acid frequency
Ala |
Cys |
Asp |
Glu |
Phe |
Gly |
His |
Ile |
Lys |
Leu |
|---|---|---|---|---|---|---|---|---|---|
7.106 ± 0.742 | 1.442 ± 0.464 |
4.84 ± 0.57 | 5.046 ± 0.794 |
3.605 ± 0.644 | 7.518 ± 0.674 |
1.545 ± 0.242 | 5.046 ± 0.537 |
7.518 ± 0.883 | 7.003 ± 1.103 |
Met |
Asn |
Gln |
Pro |
Arg |
Ser |
Thr |
Val |
Trp |
Tyr |
|---|---|---|---|---|---|---|---|---|---|
2.575 ± 0.541 | 4.016 ± 0.514 |
5.561 ± 0.674 | 3.708 ± 0.557 |
7.003 ± 0.943 | 7.827 ± 1.591 |
6.076 ± 0.51 | 7.312 ± 1.232 |
1.648 ± 0.794 | 3.605 ± 0.821 |
Most of the basic statistics you can see at this page can be downloaded from this CSV file
Proteome-pI is available under Creative Commons Attribution-NoDerivs license, for more details see here
| Reference: Kozlowski LP. Proteome-pI 2.0: Proteome Isoelectric Point Database Update. Nucleic Acids Res. 2021, doi: 10.1093/nar/gkab944 | Contact: Lukasz P. Kozlowski |
