Flavobacterium haoranii
Taxonomy: cellular organisms; Bacteria; FCB group; Bacteroidetes/Chlorobi group; Bacteroidetes; Flavobacteriia; Flavobacteriales; Flavobacteriaceae; Flavobacterium
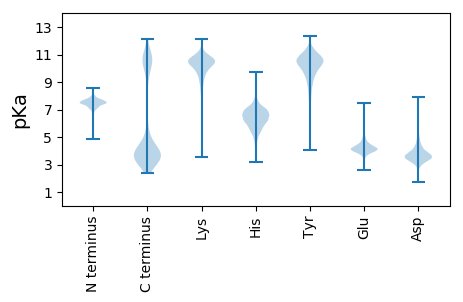
Average proteome isoelectric point is 6.48
Get precalculated fractions of proteins

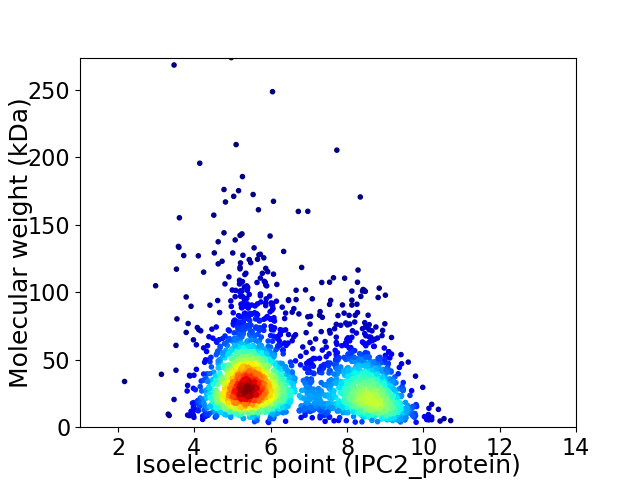
Virtual 2D-PAGE plot for 2604 proteins (isoelectric point calculated using IPC2_protein)
Get csv file with sequences according to given criteria:
* You can choose from 21 different methods for calculating isoelectric point
Summary statistics related to proteome-wise predictions


Protein with the lowest isoelectric point:
>tr|A0A1M6IW77|A0A1M6IW77_9FLAO L-threonine dehydratase OS=Flavobacterium haoranii OX=683124 GN=ilvA PE=3 SV=1
MM1 pKa = 7.96RR2 pKa = 11.84KK3 pKa = 10.09NNMNKK8 pKa = 9.44ILMSSLLALALGFVSCDD25 pKa = 3.54NQDD28 pKa = 3.58DD29 pKa = 4.04ATGDD33 pKa = 3.67SVFEE37 pKa = 4.06VTEE40 pKa = 4.23GVVASVTTDD49 pKa = 3.78FDD51 pKa = 3.67NSATITLNEE60 pKa = 3.91YY61 pKa = 10.75DD62 pKa = 3.88EE63 pKa = 5.27EE64 pKa = 4.29EE65 pKa = 4.45FPFTITLNKK74 pKa = 8.92PSSIATRR81 pKa = 11.84FRR83 pKa = 11.84IVQIGGDD90 pKa = 3.51AVLGEE95 pKa = 4.9DD96 pKa = 4.43YY97 pKa = 10.9EE98 pKa = 4.31ILNLSDD104 pKa = 3.64EE105 pKa = 4.84SIEE108 pKa = 4.14FLDD111 pKa = 3.64IPARR115 pKa = 11.84EE116 pKa = 4.15TTVSGKK122 pKa = 10.08IKK124 pKa = 10.16ILSDD128 pKa = 3.34IYY130 pKa = 11.63VEE132 pKa = 4.17DD133 pKa = 4.03TKK135 pKa = 11.01TLSIQIGNQSLANATMQYY153 pKa = 10.34EE154 pKa = 4.59VVNFAIEE161 pKa = 5.01DD162 pKa = 3.77YY163 pKa = 10.6DD164 pKa = 4.11SSEE167 pKa = 4.53MIFEE171 pKa = 4.65LNYY174 pKa = 10.77GKK176 pKa = 10.28EE177 pKa = 4.11FYY179 pKa = 10.49YY180 pKa = 10.21QGEE183 pKa = 4.38MTTTCDD189 pKa = 3.29FEE191 pKa = 6.11YY192 pKa = 11.32DD193 pKa = 2.9MDD195 pKa = 4.32YY196 pKa = 11.48LVFDD200 pKa = 4.88SNFDD204 pKa = 3.35DD205 pKa = 3.48TGIYY209 pKa = 10.54DD210 pKa = 4.45GATGACPTEE219 pKa = 4.21SLSVSVDD226 pKa = 3.37PSHH229 pKa = 7.6PNYY232 pKa = 10.74LPDD235 pKa = 3.07GTYY238 pKa = 10.74YY239 pKa = 10.28IFYY242 pKa = 10.5SVWDD246 pKa = 4.27DD247 pKa = 3.66GGLSGLYY254 pKa = 9.6HH255 pKa = 7.51DD256 pKa = 5.34VFTIPTSVEE265 pKa = 4.36FYY267 pKa = 10.86RR268 pKa = 11.84PGLLNPLNFDD278 pKa = 3.4QEE280 pKa = 4.26SAYY283 pKa = 9.99IPDD286 pKa = 3.53STYY289 pKa = 10.95GSGAEE294 pKa = 4.49DD295 pKa = 3.64YY296 pKa = 11.41VLTIEE301 pKa = 4.57INSGVISVLDD311 pKa = 3.8SNNSVLGSARR321 pKa = 11.84FAVNHH326 pKa = 6.51DD327 pKa = 3.94KK328 pKa = 10.98IKK330 pKa = 10.89AAFANARR337 pKa = 11.84AKK339 pKa = 10.37SLKK342 pKa = 10.14KK343 pKa = 10.57
MM1 pKa = 7.96RR2 pKa = 11.84KK3 pKa = 10.09NNMNKK8 pKa = 9.44ILMSSLLALALGFVSCDD25 pKa = 3.54NQDD28 pKa = 3.58DD29 pKa = 4.04ATGDD33 pKa = 3.67SVFEE37 pKa = 4.06VTEE40 pKa = 4.23GVVASVTTDD49 pKa = 3.78FDD51 pKa = 3.67NSATITLNEE60 pKa = 3.91YY61 pKa = 10.75DD62 pKa = 3.88EE63 pKa = 5.27EE64 pKa = 4.29EE65 pKa = 4.45FPFTITLNKK74 pKa = 8.92PSSIATRR81 pKa = 11.84FRR83 pKa = 11.84IVQIGGDD90 pKa = 3.51AVLGEE95 pKa = 4.9DD96 pKa = 4.43YY97 pKa = 10.9EE98 pKa = 4.31ILNLSDD104 pKa = 3.64EE105 pKa = 4.84SIEE108 pKa = 4.14FLDD111 pKa = 3.64IPARR115 pKa = 11.84EE116 pKa = 4.15TTVSGKK122 pKa = 10.08IKK124 pKa = 10.16ILSDD128 pKa = 3.34IYY130 pKa = 11.63VEE132 pKa = 4.17DD133 pKa = 4.03TKK135 pKa = 11.01TLSIQIGNQSLANATMQYY153 pKa = 10.34EE154 pKa = 4.59VVNFAIEE161 pKa = 5.01DD162 pKa = 3.77YY163 pKa = 10.6DD164 pKa = 4.11SSEE167 pKa = 4.53MIFEE171 pKa = 4.65LNYY174 pKa = 10.77GKK176 pKa = 10.28EE177 pKa = 4.11FYY179 pKa = 10.49YY180 pKa = 10.21QGEE183 pKa = 4.38MTTTCDD189 pKa = 3.29FEE191 pKa = 6.11YY192 pKa = 11.32DD193 pKa = 2.9MDD195 pKa = 4.32YY196 pKa = 11.48LVFDD200 pKa = 4.88SNFDD204 pKa = 3.35DD205 pKa = 3.48TGIYY209 pKa = 10.54DD210 pKa = 4.45GATGACPTEE219 pKa = 4.21SLSVSVDD226 pKa = 3.37PSHH229 pKa = 7.6PNYY232 pKa = 10.74LPDD235 pKa = 3.07GTYY238 pKa = 10.74YY239 pKa = 10.28IFYY242 pKa = 10.5SVWDD246 pKa = 4.27DD247 pKa = 3.66GGLSGLYY254 pKa = 9.6HH255 pKa = 7.51DD256 pKa = 5.34VFTIPTSVEE265 pKa = 4.36FYY267 pKa = 10.86RR268 pKa = 11.84PGLLNPLNFDD278 pKa = 3.4QEE280 pKa = 4.26SAYY283 pKa = 9.99IPDD286 pKa = 3.53STYY289 pKa = 10.95GSGAEE294 pKa = 4.49DD295 pKa = 3.64YY296 pKa = 11.41VLTIEE301 pKa = 4.57INSGVISVLDD311 pKa = 3.8SNNSVLGSARR321 pKa = 11.84FAVNHH326 pKa = 6.51DD327 pKa = 3.94KK328 pKa = 10.98IKK330 pKa = 10.89AAFANARR337 pKa = 11.84AKK339 pKa = 10.37SLKK342 pKa = 10.14KK343 pKa = 10.57
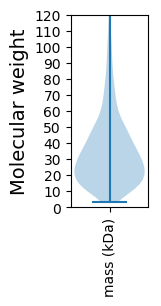
Molecular weight: 37.95 kDa
Isoelectric point according different methods:
Protein with the highest isoelectric point:
>tr|A0A1M6IW98|A0A1M6IW98_9FLAO Ketol-acid reductoisomerase OS=Flavobacterium haoranii OX=683124 GN=SAMN05444337_1891 PE=3 SV=1
MM1 pKa = 6.53VTNLLHH7 pKa = 6.76FFEE10 pKa = 4.38KK11 pKa = 10.48HH12 pKa = 5.13GFFVAQRR19 pKa = 11.84LAEE22 pKa = 4.05RR23 pKa = 11.84LGIRR27 pKa = 11.84ATNVRR32 pKa = 11.84LFFIYY37 pKa = 10.25ISFITIGLGFGFYY50 pKa = 9.4LTLAFLLRR58 pKa = 11.84LKK60 pKa = 11.2DD61 pKa = 3.61MIHH64 pKa = 6.41TKK66 pKa = 10.26RR67 pKa = 11.84SSVFDD72 pKa = 3.68LL73 pKa = 4.35
MM1 pKa = 6.53VTNLLHH7 pKa = 6.76FFEE10 pKa = 4.38KK11 pKa = 10.48HH12 pKa = 5.13GFFVAQRR19 pKa = 11.84LAEE22 pKa = 4.05RR23 pKa = 11.84LGIRR27 pKa = 11.84ATNVRR32 pKa = 11.84LFFIYY37 pKa = 10.25ISFITIGLGFGFYY50 pKa = 9.4LTLAFLLRR58 pKa = 11.84LKK60 pKa = 11.2DD61 pKa = 3.61MIHH64 pKa = 6.41TKK66 pKa = 10.26RR67 pKa = 11.84SSVFDD72 pKa = 3.68LL73 pKa = 4.35
Molecular weight: 8.57 kDa
Isoelectric point according different methods:
Peptides (in silico digests for buttom-up proteomics)
Below you can find in silico digests of the whole proteome with Trypsin, Chymotrypsin, Trypsin+LysC, LysN, ArgC proteases suitable for different mass spec machines.| Try ESI |
 |
|---|
| ChTry ESI |
 |
|---|
| ArgC ESI |
 |
|---|
| LysN ESI |
 |
|---|
| TryLysC ESI |
 |
|---|
| Try MALDI |
 |
|---|
| ChTry MALDI |
 |
|---|
| ArgC MALDI |
 |
|---|
| LysN MALDI |
 |
|---|
| TryLysC MALDI |
 |
|---|
| Try LTQ |
 |
|---|
| ChTry LTQ |
 |
|---|
| ArgC LTQ |
 |
|---|
| LysN LTQ |
 |
|---|
| TryLysC LTQ |
 |
|---|
| Try MSlow |
 |
|---|
| ChTry MSlow |
 |
|---|
| ArgC MSlow |
 |
|---|
| LysN MSlow |
 |
|---|
| TryLysC MSlow |
 |
|---|
| Try MShigh |
 |
|---|
| ChTry MShigh |
 |
|---|
| ArgC MShigh |
 |
|---|
| LysN MShigh |
 |
|---|
| TryLysC MShigh |
 |
|---|
General Statistics
Number of major isoforms |
Number of additional isoforms |
Number of all proteins |
Number of amino acids |
Min. Seq. Length |
Max. Seq. Length |
Avg. Seq. Length |
Avg. Mol. Weight |
|---|---|---|---|---|---|---|---|
0 |
857636 |
31 |
2560 |
329.4 |
37.27 |
Amino acid frequency
Ala |
Cys |
Asp |
Glu |
Phe |
Gly |
His |
Ile |
Lys |
Leu |
|---|---|---|---|---|---|---|---|---|---|
6.045 ± 0.049 | 0.771 ± 0.018 |
5.25 ± 0.039 | 6.901 ± 0.049 |
5.562 ± 0.046 | 6.125 ± 0.045 |
1.675 ± 0.021 | 8.135 ± 0.053 |
8.163 ± 0.066 | 9.12 ± 0.051 |
Met |
Asn |
Gln |
Pro |
Arg |
Ser |
Thr |
Val |
Trp |
Tyr |
|---|---|---|---|---|---|---|---|---|---|
2.143 ± 0.028 | 6.719 ± 0.061 |
3.212 ± 0.028 | 3.476 ± 0.025 |
3.04 ± 0.026 | 6.386 ± 0.041 |
5.776 ± 0.06 | 6.371 ± 0.041 |
0.97 ± 0.017 | 4.159 ± 0.033 |
Most of the basic statistics you can see at this page can be downloaded from this CSV file
Proteome-pI is available under Creative Commons Attribution-NoDerivs license, for more details see here
| Reference: Kozlowski LP. Proteome-pI 2.0: Proteome Isoelectric Point Database Update. Nucleic Acids Res. 2021, doi: 10.1093/nar/gkab944 | Contact: Lukasz P. Kozlowski |
