SAR202 cluster bacterium AD-802-F09_MRT_200m
Taxonomy: cellular organisms; Bacteria; Terrabacteria group; Chloroflexi; Chloroflexi incertae sedis; SAR202 cluster
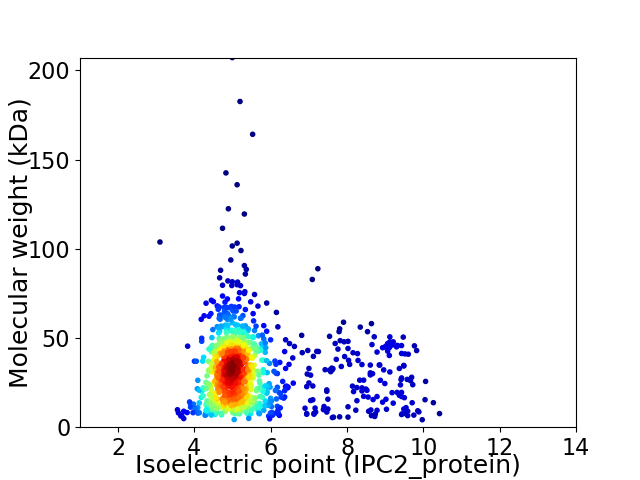
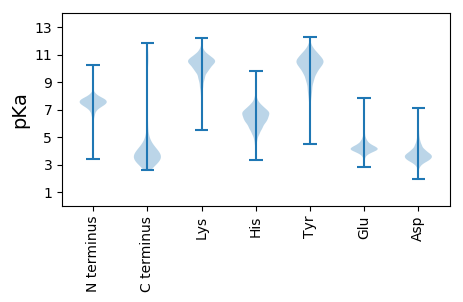
Average proteome isoelectric point is 5.54
Get precalculated fractions of proteins

Virtual 2D-PAGE plot for 1047 proteins (isoelectric point calculated using IPC2_protein)
Get csv file with sequences according to given criteria:
* You can choose from 21 different methods for calculating isoelectric point
Summary statistics related to proteome-wise predictions


Protein with the lowest isoelectric point:
>tr|A0A5N8YNQ9|A0A5N8YNQ9_9CHLR DUF5681 domain-containing protein OS=SAR202 cluster bacterium AD-802-F09_MRT_200m OX=2587839 GN=FIM07_02610 PE=4 SV=1
MM1 pKa = 7.35LPDD4 pKa = 3.24ARR6 pKa = 11.84SRR8 pKa = 11.84LTHH11 pKa = 6.37CFSVVFPEE19 pKa = 5.32LEE21 pKa = 3.97EE22 pKa = 4.03QEE24 pKa = 4.5IPVSSIASVGAWDD37 pKa = 3.94SLASINLYY45 pKa = 10.66SLVEE49 pKa = 3.99EE50 pKa = 4.32EE51 pKa = 5.23FGVEE55 pKa = 3.9INMDD59 pKa = 3.85DD60 pKa = 4.32LEE62 pKa = 4.23NLISFEE68 pKa = 4.99LILGYY73 pKa = 10.03IEE75 pKa = 5.01GGNDD79 pKa = 2.99ASS81 pKa = 3.87
MM1 pKa = 7.35LPDD4 pKa = 3.24ARR6 pKa = 11.84SRR8 pKa = 11.84LTHH11 pKa = 6.37CFSVVFPEE19 pKa = 5.32LEE21 pKa = 3.97EE22 pKa = 4.03QEE24 pKa = 4.5IPVSSIASVGAWDD37 pKa = 3.94SLASINLYY45 pKa = 10.66SLVEE49 pKa = 3.99EE50 pKa = 4.32EE51 pKa = 5.23FGVEE55 pKa = 3.9INMDD59 pKa = 3.85DD60 pKa = 4.32LEE62 pKa = 4.23NLISFEE68 pKa = 4.99LILGYY73 pKa = 10.03IEE75 pKa = 5.01GGNDD79 pKa = 2.99ASS81 pKa = 3.87
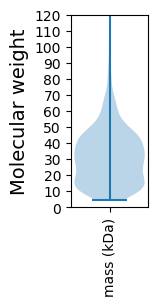
Molecular weight: 8.94 kDa
Isoelectric point according different methods:
Protein with the highest isoelectric point:
>tr|A0A5N8YP99|A0A5N8YP99_9CHLR Xanthine dehydrogenase family protein molybdopterin-binding subunit OS=SAR202 cluster bacterium AD-802-F09_MRT_200m OX=2587839 GN=FIM07_03505 PE=4 SV=1
MM1 pKa = 6.78GAEE4 pKa = 4.18YY5 pKa = 10.29RR6 pKa = 11.84RR7 pKa = 11.84PGYY10 pKa = 8.69STSSAADD17 pKa = 3.19RR18 pKa = 11.84RR19 pKa = 11.84LRR21 pKa = 11.84RR22 pKa = 11.84NTLTWFKK29 pKa = 10.48DD30 pKa = 2.98ATIIYY35 pKa = 10.43SLGNLLARR43 pKa = 11.84FCFRR47 pKa = 11.84TFGRR51 pKa = 11.84LHH53 pKa = 5.87VSGAEE58 pKa = 4.06GVPKK62 pKa = 10.54FGPLIVVSNHH72 pKa = 6.08LSLNDD77 pKa = 3.71PPLLVATIPRR87 pKa = 11.84PLYY90 pKa = 10.5FIGKK94 pKa = 9.28KK95 pKa = 9.07EE96 pKa = 3.95LFGNPITRR104 pKa = 11.84LGMRR108 pKa = 11.84LFHH111 pKa = 6.3VSSFNRR117 pKa = 11.84SAAGIDD123 pKa = 3.44AVRR126 pKa = 11.84VLMQNLEE133 pKa = 3.78RR134 pKa = 11.84DD135 pKa = 3.46RR136 pKa = 11.84AVVIFPEE143 pKa = 5.18GTRR146 pKa = 11.84SPDD149 pKa = 3.3GALHH153 pKa = 6.76RR154 pKa = 11.84GMLGVVYY161 pKa = 10.26LALKK165 pKa = 9.53SQAAILPVGVTGTEE179 pKa = 4.17KK180 pKa = 10.64FPLWRR185 pKa = 11.84IPFPFRR191 pKa = 11.84KK192 pKa = 8.47MKK194 pKa = 10.79ASIGQPFTLPVIEE207 pKa = 4.39GTPSKK212 pKa = 10.93EE213 pKa = 4.13VMSSLTDD220 pKa = 3.28MVMSRR225 pKa = 11.84IADD228 pKa = 3.63QLPQEE233 pKa = 4.23YY234 pKa = 9.38RR235 pKa = 11.84GVYY238 pKa = 9.67ARR240 pKa = 11.84EE241 pKa = 3.77IKK243 pKa = 10.0QRR245 pKa = 11.84PAEE248 pKa = 4.02QAVV251 pKa = 3.17
MM1 pKa = 6.78GAEE4 pKa = 4.18YY5 pKa = 10.29RR6 pKa = 11.84RR7 pKa = 11.84PGYY10 pKa = 8.69STSSAADD17 pKa = 3.19RR18 pKa = 11.84RR19 pKa = 11.84LRR21 pKa = 11.84RR22 pKa = 11.84NTLTWFKK29 pKa = 10.48DD30 pKa = 2.98ATIIYY35 pKa = 10.43SLGNLLARR43 pKa = 11.84FCFRR47 pKa = 11.84TFGRR51 pKa = 11.84LHH53 pKa = 5.87VSGAEE58 pKa = 4.06GVPKK62 pKa = 10.54FGPLIVVSNHH72 pKa = 6.08LSLNDD77 pKa = 3.71PPLLVATIPRR87 pKa = 11.84PLYY90 pKa = 10.5FIGKK94 pKa = 9.28KK95 pKa = 9.07EE96 pKa = 3.95LFGNPITRR104 pKa = 11.84LGMRR108 pKa = 11.84LFHH111 pKa = 6.3VSSFNRR117 pKa = 11.84SAAGIDD123 pKa = 3.44AVRR126 pKa = 11.84VLMQNLEE133 pKa = 3.78RR134 pKa = 11.84DD135 pKa = 3.46RR136 pKa = 11.84AVVIFPEE143 pKa = 5.18GTRR146 pKa = 11.84SPDD149 pKa = 3.3GALHH153 pKa = 6.76RR154 pKa = 11.84GMLGVVYY161 pKa = 10.26LALKK165 pKa = 9.53SQAAILPVGVTGTEE179 pKa = 4.17KK180 pKa = 10.64FPLWRR185 pKa = 11.84IPFPFRR191 pKa = 11.84KK192 pKa = 8.47MKK194 pKa = 10.79ASIGQPFTLPVIEE207 pKa = 4.39GTPSKK212 pKa = 10.93EE213 pKa = 4.13VMSSLTDD220 pKa = 3.28MVMSRR225 pKa = 11.84IADD228 pKa = 3.63QLPQEE233 pKa = 4.23YY234 pKa = 9.38RR235 pKa = 11.84GVYY238 pKa = 9.67ARR240 pKa = 11.84EE241 pKa = 3.77IKK243 pKa = 10.0QRR245 pKa = 11.84PAEE248 pKa = 4.02QAVV251 pKa = 3.17
Molecular weight: 27.97 kDa
Isoelectric point according different methods:
Peptides (in silico digests for buttom-up proteomics)
Below you can find in silico digests of the whole proteome with Trypsin, Chymotrypsin, Trypsin+LysC, LysN, ArgC proteases suitable for different mass spec machines.| Try ESI |
 |
|---|
| ChTry ESI |
 |
|---|
| ArgC ESI |
 |
|---|
| LysN ESI |
 |
|---|
| TryLysC ESI |
 |
|---|
| Try MALDI |
 |
|---|
| ChTry MALDI |
 |
|---|
| ArgC MALDI |
 |
|---|
| LysN MALDI |
 |
|---|
| TryLysC MALDI |
 |
|---|
| Try LTQ |
 |
|---|
| ChTry LTQ |
 |
|---|
| ArgC LTQ |
 |
|---|
| LysN LTQ |
 |
|---|
| TryLysC LTQ |
 |
|---|
| Try MSlow |
 |
|---|
| ChTry MSlow |
 |
|---|
| ArgC MSlow |
 |
|---|
| LysN MSlow |
 |
|---|
| TryLysC MSlow |
 |
|---|
| Try MShigh |
 |
|---|
| ChTry MShigh |
 |
|---|
| ArgC MShigh |
 |
|---|
| LysN MShigh |
 |
|---|
| TryLysC MShigh |
 |
|---|
General Statistics
Number of major isoforms |
Number of additional isoforms |
Number of all proteins |
Number of amino acids |
Min. Seq. Length |
Max. Seq. Length |
Avg. Seq. Length |
Avg. Mol. Weight |
|---|---|---|---|---|---|---|---|
0 |
312120 |
36 |
1854 |
298.1 |
32.67 |
Amino acid frequency
Ala |
Cys |
Asp |
Glu |
Phe |
Gly |
His |
Ile |
Lys |
Leu |
|---|---|---|---|---|---|---|---|---|---|
9.067 ± 0.084 | 0.962 ± 0.024 |
5.932 ± 0.064 | 6.333 ± 0.066 |
3.888 ± 0.051 | 8.712 ± 0.071 |
2.114 ± 0.03 | 5.833 ± 0.056 |
3.386 ± 0.044 | 9.479 ± 0.084 |
Met |
Asn |
Gln |
Pro |
Arg |
Ser |
Thr |
Val |
Trp |
Tyr |
|---|---|---|---|---|---|---|---|---|---|
2.76 ± 0.049 | 3.36 ± 0.041 |
5.041 ± 0.05 | 3.378 ± 0.04 |
5.647 ± 0.064 | 6.543 ± 0.052 |
5.487 ± 0.048 | 7.771 ± 0.072 |
1.495 ± 0.029 | 2.811 ± 0.039 |
Most of the basic statistics you can see at this page can be downloaded from this CSV file
Proteome-pI is available under Creative Commons Attribution-NoDerivs license, for more details see here
| Reference: Kozlowski LP. Proteome-pI 2.0: Proteome Isoelectric Point Database Update. Nucleic Acids Res. 2021, doi: 10.1093/nar/gkab944 | Contact: Lukasz P. Kozlowski |
