Silvanigrellales bacterium RF1110005
Taxonomy: cellular organisms; Bacteria; Proteobacteria; Oligoflexia; Silvanigrellales; Silvanigrellaceae; Fluviispira
Average proteome isoelectric point is 7.15
Get precalculated fractions of proteins
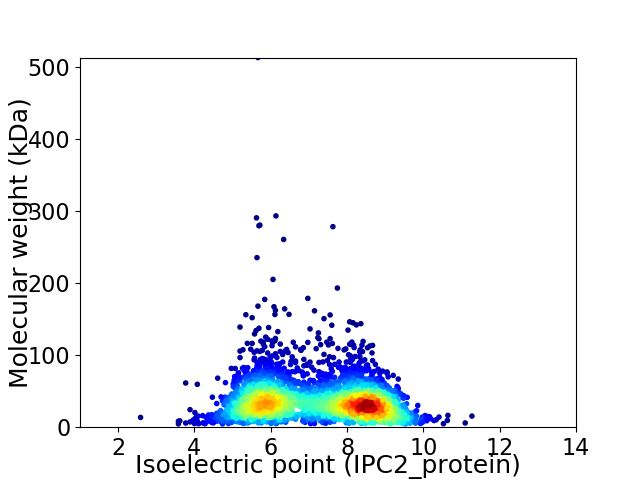
Virtual 2D-PAGE plot for 3167 proteins (isoelectric point calculated using IPC2_protein)
Get csv file with sequences according to given criteria:
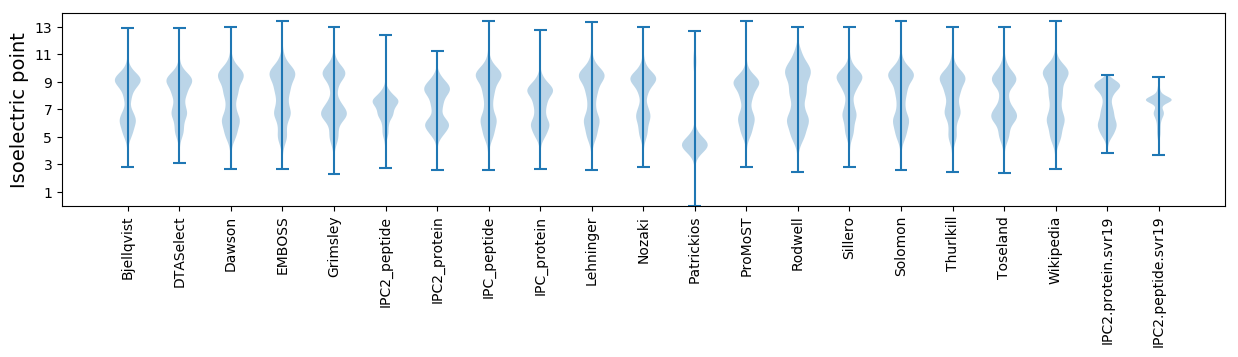
* You can choose from 21 different methods for calculating isoelectric point
Summary statistics related to proteome-wise predictions
Protein with the lowest isoelectric point:
>tr|A0A4P2VN09|A0A4P2VN09_9PROT Uncharacterized protein OS=Silvanigrellales bacterium RF1110005 OX=2493639 GN=JCM31447_28660 PE=4 SV=1
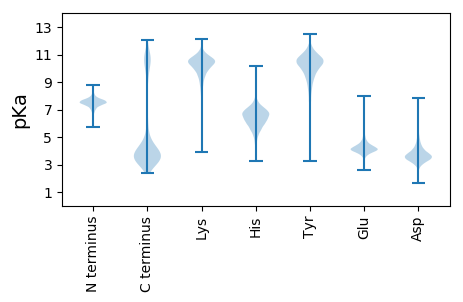
MM1 pKa = 7.62IDD3 pKa = 4.42DD4 pKa = 4.0YY5 pKa = 11.78FMNYY9 pKa = 10.17SILDD13 pKa = 4.01DD14 pKa = 4.31EE15 pKa = 5.92LEE17 pKa = 4.4SDD19 pKa = 5.46DD20 pKa = 5.5DD21 pKa = 4.33NEE23 pKa = 4.56SLGVRR28 pKa = 11.84TEE30 pKa = 3.74KK31 pKa = 10.74LIRR34 pKa = 11.84DD35 pKa = 3.49IDD37 pKa = 3.97SDD39 pKa = 4.36IEE41 pKa = 4.08NLTEE45 pKa = 3.89NEE47 pKa = 3.73FMDD50 pKa = 3.67IYY52 pKa = 11.17GVSTEE57 pKa = 3.64IAKK60 pKa = 9.63YY61 pKa = 10.07QGMTKK66 pKa = 10.29EE67 pKa = 4.44EE68 pKa = 4.24YY69 pKa = 10.39EE70 pKa = 4.16EE71 pKa = 5.18LYY73 pKa = 11.08SS74 pKa = 4.3
MM1 pKa = 7.62IDD3 pKa = 4.42DD4 pKa = 4.0YY5 pKa = 11.78FMNYY9 pKa = 10.17SILDD13 pKa = 4.01DD14 pKa = 4.31EE15 pKa = 5.92LEE17 pKa = 4.4SDD19 pKa = 5.46DD20 pKa = 5.5DD21 pKa = 4.33NEE23 pKa = 4.56SLGVRR28 pKa = 11.84TEE30 pKa = 3.74KK31 pKa = 10.74LIRR34 pKa = 11.84DD35 pKa = 3.49IDD37 pKa = 3.97SDD39 pKa = 4.36IEE41 pKa = 4.08NLTEE45 pKa = 3.89NEE47 pKa = 3.73FMDD50 pKa = 3.67IYY52 pKa = 11.17GVSTEE57 pKa = 3.64IAKK60 pKa = 9.63YY61 pKa = 10.07QGMTKK66 pKa = 10.29EE67 pKa = 4.44EE68 pKa = 4.24YY69 pKa = 10.39EE70 pKa = 4.16EE71 pKa = 5.18LYY73 pKa = 11.08SS74 pKa = 4.3
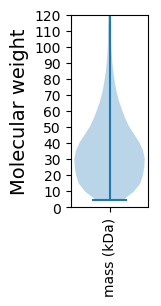
Molecular weight: 8.75 kDa
Isoelectric point according different methods:
Protein with the highest isoelectric point:
>tr|A0A4P2VJP6|A0A4P2VJP6_9PROT PNPLA domain-containing protein OS=Silvanigrellales bacterium RF1110005 OX=2493639 GN=JCM31447_12010 PE=4 SV=1
MM1 pKa = 5.7VTRR4 pKa = 11.84RR5 pKa = 11.84KK6 pKa = 9.97KK7 pKa = 10.75AGTKK11 pKa = 9.28TKK13 pKa = 9.63TAGKK17 pKa = 9.64KK18 pKa = 9.03RR19 pKa = 11.84RR20 pKa = 11.84KK21 pKa = 7.97TSSKK25 pKa = 9.17KK26 pKa = 6.49TTATKK31 pKa = 10.42RR32 pKa = 11.84KK33 pKa = 8.88RR34 pKa = 11.84KK35 pKa = 8.12KK36 pKa = 8.37TAGKK40 pKa = 8.44KK41 pKa = 5.29TTATKK46 pKa = 10.46RR47 pKa = 11.84KK48 pKa = 8.88RR49 pKa = 11.84KK50 pKa = 8.12KK51 pKa = 8.37TAGKK55 pKa = 8.44KK56 pKa = 5.29TTATKK61 pKa = 10.46RR62 pKa = 11.84KK63 pKa = 8.88RR64 pKa = 11.84KK65 pKa = 8.12KK66 pKa = 8.37TAGKK70 pKa = 8.44KK71 pKa = 5.29TTATKK76 pKa = 10.42RR77 pKa = 11.84KK78 pKa = 9.09RR79 pKa = 11.84KK80 pKa = 8.45KK81 pKa = 7.09TTATKK86 pKa = 10.07TGVKK90 pKa = 8.03KK91 pKa = 9.25TKK93 pKa = 10.22RR94 pKa = 11.84KK95 pKa = 9.83AKK97 pKa = 10.1RR98 pKa = 11.84KK99 pKa = 7.09TKK101 pKa = 10.48LSVVSKK107 pKa = 8.1TRR109 pKa = 11.84KK110 pKa = 9.37RR111 pKa = 11.84KK112 pKa = 7.41TKK114 pKa = 10.43RR115 pKa = 11.84KK116 pKa = 4.83TTARR120 pKa = 11.84KK121 pKa = 8.59VVARR125 pKa = 11.84KK126 pKa = 7.91TSDD129 pKa = 2.85KK130 pKa = 10.6HH131 pKa = 6.0LKK133 pKa = 9.45KK134 pKa = 10.74AGG136 pKa = 3.42
MM1 pKa = 5.7VTRR4 pKa = 11.84RR5 pKa = 11.84KK6 pKa = 9.97KK7 pKa = 10.75AGTKK11 pKa = 9.28TKK13 pKa = 9.63TAGKK17 pKa = 9.64KK18 pKa = 9.03RR19 pKa = 11.84RR20 pKa = 11.84KK21 pKa = 7.97TSSKK25 pKa = 9.17KK26 pKa = 6.49TTATKK31 pKa = 10.42RR32 pKa = 11.84KK33 pKa = 8.88RR34 pKa = 11.84KK35 pKa = 8.12KK36 pKa = 8.37TAGKK40 pKa = 8.44KK41 pKa = 5.29TTATKK46 pKa = 10.46RR47 pKa = 11.84KK48 pKa = 8.88RR49 pKa = 11.84KK50 pKa = 8.12KK51 pKa = 8.37TAGKK55 pKa = 8.44KK56 pKa = 5.29TTATKK61 pKa = 10.46RR62 pKa = 11.84KK63 pKa = 8.88RR64 pKa = 11.84KK65 pKa = 8.12KK66 pKa = 8.37TAGKK70 pKa = 8.44KK71 pKa = 5.29TTATKK76 pKa = 10.42RR77 pKa = 11.84KK78 pKa = 9.09RR79 pKa = 11.84KK80 pKa = 8.45KK81 pKa = 7.09TTATKK86 pKa = 10.07TGVKK90 pKa = 8.03KK91 pKa = 9.25TKK93 pKa = 10.22RR94 pKa = 11.84KK95 pKa = 9.83AKK97 pKa = 10.1RR98 pKa = 11.84KK99 pKa = 7.09TKK101 pKa = 10.48LSVVSKK107 pKa = 8.1TRR109 pKa = 11.84KK110 pKa = 9.37RR111 pKa = 11.84KK112 pKa = 7.41TKK114 pKa = 10.43RR115 pKa = 11.84KK116 pKa = 4.83TTARR120 pKa = 11.84KK121 pKa = 8.59VVARR125 pKa = 11.84KK126 pKa = 7.91TSDD129 pKa = 2.85KK130 pKa = 10.6HH131 pKa = 6.0LKK133 pKa = 9.45KK134 pKa = 10.74AGG136 pKa = 3.42
Molecular weight: 15.43 kDa
Isoelectric point according different methods:
Peptides (in silico digests for buttom-up proteomics)
Below you can find in silico digests of the whole proteome with Trypsin, Chymotrypsin, Trypsin+LysC, LysN, ArgC proteases suitable for different mass spec machines.| Try ESI |
 |
|---|
| ChTry ESI |
|
|---|
| ArgC ESI |
|
|---|
| LysN ESI |
|
|---|
| TryLysC ESI |
|
|---|
| Try MALDI |
|
|---|
| ChTry MALDI |
|
|---|
| ArgC MALDI |
|
|---|
| LysN MALDI |
|
|---|
| TryLysC MALDI |
|
|---|
| Try LTQ |
|
|---|
| ChTry LTQ |
|
|---|
| ArgC LTQ |
|
|---|
| LysN LTQ |
|
|---|
| TryLysC LTQ |
|
|---|
| Try MSlow |
|
|---|
| ChTry MSlow |
|
|---|
| ArgC MSlow |
|
|---|
| LysN MSlow |
|
|---|
| TryLysC MSlow |
|
|---|
| Try MShigh |
|
|---|
| ChTry MShigh |
|
|---|
| ArgC MShigh |
|
|---|
| LysN MShigh |
|
|---|
| TryLysC MShigh |
|
|---|
General Statistics
Number of major isoforms |
Number of additional isoforms |
Number of all proteins |
Number of amino acids |
Min. Seq. Length |
Max. Seq. Length |
Avg. Seq. Length |
Avg. Mol. Weight |
|---|---|---|---|---|---|---|---|
0 |
1068353 |
39 |
4399 |
337.3 |
38.17 |
Amino acid frequency
Ala |
Cys |
Asp |
Glu |
Phe |
Gly |
His |
Ile |
Lys |
Leu |
|---|---|---|---|---|---|---|---|---|---|
6.356 ± 0.045 | 1.175 ± 0.015 |
4.73 ± 0.026 | 6.576 ± 0.046 |
5.403 ± 0.039 | 5.494 ± 0.042 |
1.886 ± 0.016 | 8.805 ± 0.048 |
8.254 ± 0.046 | 9.908 ± 0.044 |
Met |
Asn |
Gln |
Pro |
Arg |
Ser |
Thr |
Val |
Trp |
Tyr |
|---|---|---|---|---|---|---|---|---|---|
2.086 ± 0.017 | 6.402 ± 0.055 |
3.472 ± 0.025 | 3.451 ± 0.025 |
3.668 ± 0.034 | 7.607 ± 0.042 |
4.771 ± 0.032 | 5.413 ± 0.034 |
0.971 ± 0.014 | 3.572 ± 0.034 |
Most of the basic statistics you can see at this page can be downloaded from this CSV file
See this proteome in:

Proteome-pI is available under Creative Commons Attribution-NoDerivs license, for more details see here
| Reference: Kozlowski LP. Proteome-pI 2.0: Proteome Isoelectric Point Database Update. Nucleic Acids Res. 2021, doi: 10.1093/nar/gkab944 | Contact: Lukasz P. Kozlowski |