Beihai mantis shrimp virus 6
Taxonomy: Viruses; Riboviria; unclassified Riboviria; unclassified RNA viruses ShiM-2016
Average proteome isoelectric point is 6.55
Get precalculated fractions of proteins

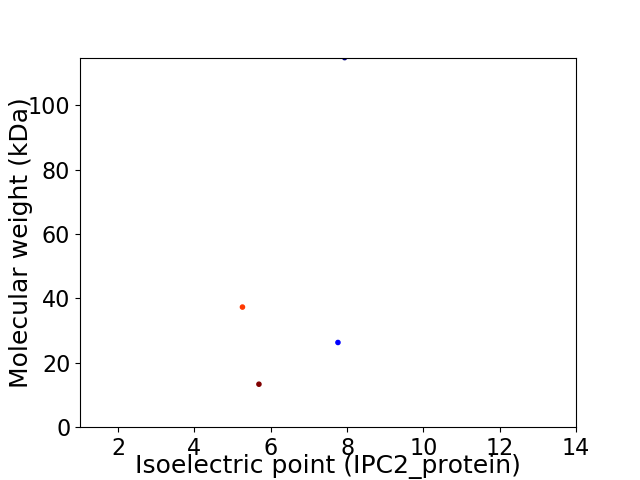
Virtual 2D-PAGE plot for 4 proteins (isoelectric point calculated using IPC2_protein)
Get csv file with sequences according to given criteria:
* You can choose from 21 different methods for calculating isoelectric point
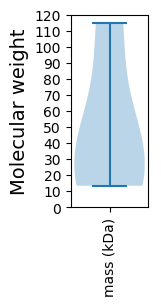
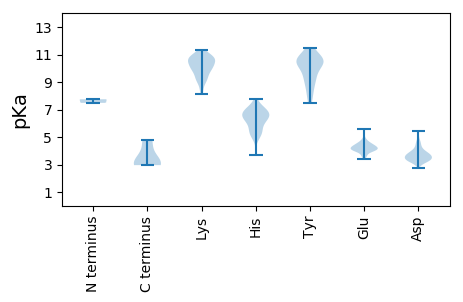
Summary statistics related to proteome-wise predictions


Protein with the lowest isoelectric point:
>tr|A0A1L3KFK8|A0A1L3KFK8_9VIRU RNA replicase OS=Beihai mantis shrimp virus 6 OX=1922433 PE=3 SV=1
MM1 pKa = 7.54VGQQSIGAAVTTVPVRR17 pKa = 11.84PPTNSIRR24 pKa = 11.84IRR26 pKa = 11.84GSDD29 pKa = 3.4TVTLIKK35 pKa = 10.6DD36 pKa = 3.34VATIGTEE43 pKa = 3.91AGDD46 pKa = 3.55VLIDD50 pKa = 3.7LRR52 pKa = 11.84LVPSISNRR60 pKa = 11.84LAIHH64 pKa = 5.62ATCYY68 pKa = 10.95NEE70 pKa = 4.11IFYY73 pKa = 10.59HH74 pKa = 5.54GLKK77 pKa = 10.56ARR79 pKa = 11.84INGQASSLTVGSIIMAFCSDD99 pKa = 4.18PADD102 pKa = 4.74EE103 pKa = 4.78IPSGVEE109 pKa = 3.56AIAWARR115 pKa = 11.84SQQCNVSGKK124 pKa = 8.11YY125 pKa = 8.59WEE127 pKa = 4.59TIEE130 pKa = 5.61LNIPHH135 pKa = 6.25SQLVGPNGGCFKK147 pKa = 11.11NNAGTSTAPRR157 pKa = 11.84TYY159 pKa = 10.66SPGFLAVIVVSPANQSTPLEE179 pKa = 4.38LQLEE183 pKa = 4.41WDD185 pKa = 3.65VTLRR189 pKa = 11.84NPTLNTLVEE198 pKa = 4.21EE199 pKa = 5.12GPRR202 pKa = 11.84VVTALKK208 pKa = 10.81DD209 pKa = 3.68FGLQGSATADD219 pKa = 3.24QAYY222 pKa = 10.44DD223 pKa = 3.58PNLKK227 pKa = 9.95VFPEE231 pKa = 4.55GDD233 pKa = 3.18LAATDD238 pKa = 4.59FSPSLEE244 pKa = 3.73ADD246 pKa = 3.13KK247 pKa = 11.29YY248 pKa = 9.22YY249 pKa = 10.53VIPGGQVTVTANTGASGAPASVVATHH275 pKa = 6.84IGLVGDD281 pKa = 3.4KK282 pKa = 10.74VGLYY286 pKa = 9.86RR287 pKa = 11.84YY288 pKa = 9.52LISSDD293 pKa = 3.17EE294 pKa = 4.35FKK296 pKa = 10.97AITATEE302 pKa = 4.18LPYY305 pKa = 10.72KK306 pKa = 10.12PSLLAAPTWRR316 pKa = 11.84EE317 pKa = 3.38ASEE320 pKa = 4.13WKK322 pKa = 9.29TDD324 pKa = 3.56PDD326 pKa = 3.8SPGFGTPTQGFRR338 pKa = 11.84LLSLQSSPSRR348 pKa = 11.84RR349 pKa = 11.84RR350 pKa = 11.84AA351 pKa = 3.04
MM1 pKa = 7.54VGQQSIGAAVTTVPVRR17 pKa = 11.84PPTNSIRR24 pKa = 11.84IRR26 pKa = 11.84GSDD29 pKa = 3.4TVTLIKK35 pKa = 10.6DD36 pKa = 3.34VATIGTEE43 pKa = 3.91AGDD46 pKa = 3.55VLIDD50 pKa = 3.7LRR52 pKa = 11.84LVPSISNRR60 pKa = 11.84LAIHH64 pKa = 5.62ATCYY68 pKa = 10.95NEE70 pKa = 4.11IFYY73 pKa = 10.59HH74 pKa = 5.54GLKK77 pKa = 10.56ARR79 pKa = 11.84INGQASSLTVGSIIMAFCSDD99 pKa = 4.18PADD102 pKa = 4.74EE103 pKa = 4.78IPSGVEE109 pKa = 3.56AIAWARR115 pKa = 11.84SQQCNVSGKK124 pKa = 8.11YY125 pKa = 8.59WEE127 pKa = 4.59TIEE130 pKa = 5.61LNIPHH135 pKa = 6.25SQLVGPNGGCFKK147 pKa = 11.11NNAGTSTAPRR157 pKa = 11.84TYY159 pKa = 10.66SPGFLAVIVVSPANQSTPLEE179 pKa = 4.38LQLEE183 pKa = 4.41WDD185 pKa = 3.65VTLRR189 pKa = 11.84NPTLNTLVEE198 pKa = 4.21EE199 pKa = 5.12GPRR202 pKa = 11.84VVTALKK208 pKa = 10.81DD209 pKa = 3.68FGLQGSATADD219 pKa = 3.24QAYY222 pKa = 10.44DD223 pKa = 3.58PNLKK227 pKa = 9.95VFPEE231 pKa = 4.55GDD233 pKa = 3.18LAATDD238 pKa = 4.59FSPSLEE244 pKa = 3.73ADD246 pKa = 3.13KK247 pKa = 11.29YY248 pKa = 9.22YY249 pKa = 10.53VIPGGQVTVTANTGASGAPASVVATHH275 pKa = 6.84IGLVGDD281 pKa = 3.4KK282 pKa = 10.74VGLYY286 pKa = 9.86RR287 pKa = 11.84YY288 pKa = 9.52LISSDD293 pKa = 3.17EE294 pKa = 4.35FKK296 pKa = 10.97AITATEE302 pKa = 4.18LPYY305 pKa = 10.72KK306 pKa = 10.12PSLLAAPTWRR316 pKa = 11.84EE317 pKa = 3.38ASEE320 pKa = 4.13WKK322 pKa = 9.29TDD324 pKa = 3.56PDD326 pKa = 3.8SPGFGTPTQGFRR338 pKa = 11.84LLSLQSSPSRR348 pKa = 11.84RR349 pKa = 11.84RR350 pKa = 11.84AA351 pKa = 3.04
Molecular weight: 37.32 kDa
Isoelectric point according different methods:
Protein with the highest isoelectric point:
>tr|A0A1L3KFH9|A0A1L3KFH9_9VIRU Capsid protein OS=Beihai mantis shrimp virus 6 OX=1922433 PE=3 SV=1
MM1 pKa = 7.71DD2 pKa = 4.44TLLQVLRR9 pKa = 11.84GIAPGAASLLRR20 pKa = 11.84LTRR23 pKa = 11.84WVAGNLKK30 pKa = 8.83STLLGVPWTTLPATTTSSLLATLRR54 pKa = 11.84WTIKK58 pKa = 10.44FLVQSKK64 pKa = 9.97EE65 pKa = 3.89RR66 pKa = 11.84LLPALTLTTTSLRR79 pKa = 11.84EE80 pKa = 4.05AGTGCLGEE88 pKa = 4.85EE89 pKa = 4.04IWEE92 pKa = 4.29SSTPSVLLQLPDD104 pKa = 3.7PTEE107 pKa = 4.22SALSPLKK114 pKa = 9.39TALWNTQFQVGRR126 pKa = 11.84FGDD129 pKa = 3.54IEE131 pKa = 4.39FGIGLLAEE139 pKa = 4.24SMSYY143 pKa = 8.13YY144 pKa = 9.9TNRR147 pKa = 11.84TISMVIHH154 pKa = 6.67PGCSTACDD162 pKa = 3.84RR163 pKa = 11.84SCSCWDD169 pKa = 3.48FRR171 pKa = 11.84PSPSLRR177 pKa = 11.84SIMPGLFLIWLTARR191 pKa = 11.84LCGLSPSIRR200 pKa = 11.84LGYY203 pKa = 8.29MAGYY207 pKa = 10.5LSRR210 pKa = 11.84CIFAGCGGWTTVAHH224 pKa = 6.73LALAGICIAPYY235 pKa = 7.8WTANLPLAA243 pKa = 4.76
MM1 pKa = 7.71DD2 pKa = 4.44TLLQVLRR9 pKa = 11.84GIAPGAASLLRR20 pKa = 11.84LTRR23 pKa = 11.84WVAGNLKK30 pKa = 8.83STLLGVPWTTLPATTTSSLLATLRR54 pKa = 11.84WTIKK58 pKa = 10.44FLVQSKK64 pKa = 9.97EE65 pKa = 3.89RR66 pKa = 11.84LLPALTLTTTSLRR79 pKa = 11.84EE80 pKa = 4.05AGTGCLGEE88 pKa = 4.85EE89 pKa = 4.04IWEE92 pKa = 4.29SSTPSVLLQLPDD104 pKa = 3.7PTEE107 pKa = 4.22SALSPLKK114 pKa = 9.39TALWNTQFQVGRR126 pKa = 11.84FGDD129 pKa = 3.54IEE131 pKa = 4.39FGIGLLAEE139 pKa = 4.24SMSYY143 pKa = 8.13YY144 pKa = 9.9TNRR147 pKa = 11.84TISMVIHH154 pKa = 6.67PGCSTACDD162 pKa = 3.84RR163 pKa = 11.84SCSCWDD169 pKa = 3.48FRR171 pKa = 11.84PSPSLRR177 pKa = 11.84SIMPGLFLIWLTARR191 pKa = 11.84LCGLSPSIRR200 pKa = 11.84LGYY203 pKa = 8.29MAGYY207 pKa = 10.5LSRR210 pKa = 11.84CIFAGCGGWTTVAHH224 pKa = 6.73LALAGICIAPYY235 pKa = 7.8WTANLPLAA243 pKa = 4.76
Molecular weight: 26.32 kDa
Isoelectric point according different methods:
Peptides (in silico digests for buttom-up proteomics)
Below you can find in silico digests of the whole proteome with Trypsin, Chymotrypsin, Trypsin+LysC, LysN, ArgC proteases suitable for different mass spec machines.| Try ESI |
 |
|---|
| ChTry ESI |
 |
|---|
| ArgC ESI |
 |
|---|
| LysN ESI |
 |
|---|
| TryLysC ESI |
 |
|---|
| Try MALDI |
 |
|---|
| ChTry MALDI |
 |
|---|
| ArgC MALDI |
 |
|---|
| LysN MALDI |
 |
|---|
| TryLysC MALDI |
 |
|---|
| Try LTQ |
 |
|---|
| ChTry LTQ |
 |
|---|
| ArgC LTQ |
 |
|---|
| LysN LTQ |
 |
|---|
| TryLysC LTQ |
 |
|---|
| Try MSlow |
 |
|---|
| ChTry MSlow |
 |
|---|
| ArgC MSlow |
 |
|---|
| LysN MSlow |
 |
|---|
| TryLysC MSlow |
 |
|---|
| Try MShigh |
 |
|---|
| ChTry MShigh |
 |
|---|
| ArgC MShigh |
 |
|---|
| LysN MShigh |
 |
|---|
| TryLysC MShigh |
 |
|---|
General Statistics
Number of major isoforms |
Number of additional isoforms |
Number of all proteins |
Number of amino acids |
Min. Seq. Length |
Max. Seq. Length |
Avg. Seq. Length |
Avg. Mol. Weight |
|---|---|---|---|---|---|---|---|
0 |
1748 |
121 |
1033 |
437.0 |
47.95 |
Amino acid frequency
Ala |
Cys |
Asp |
Glu |
Phe |
Gly |
His |
Ile |
Lys |
Leu |
|---|---|---|---|---|---|---|---|---|---|
8.982 ± 0.718 | 2.002 ± 0.356 |
5.206 ± 0.838 | 5.092 ± 0.853 |
3.146 ± 0.397 | 8.238 ± 0.333 |
2.174 ± 0.559 | 3.776 ± 0.848 |
4.005 ± 0.59 | 10.069 ± 1.299 |
Met |
Asn |
Gln |
Pro |
Arg |
Ser |
Thr |
Val |
Trp |
Tyr |
|---|---|---|---|---|---|---|---|---|---|
1.487 ± 0.263 | 2.574 ± 0.39 |
6.636 ± 0.221 | 3.432 ± 0.29 |
6.922 ± 0.763 | 7.037 ± 0.785 |
7.38 ± 0.807 | 6.808 ± 0.671 |
2.002 ± 0.369 | 3.032 ± 0.292 |
Most of the basic statistics you can see at this page can be downloaded from this CSV file
Proteome-pI is available under Creative Commons Attribution-NoDerivs license, for more details see here
| Reference: Kozlowski LP. Proteome-pI 2.0: Proteome Isoelectric Point Database Update. Nucleic Acids Res. 2021, doi: 10.1093/nar/gkab944 | Contact: Lukasz P. Kozlowski |
