Acinetobacter sp. TGL-Y2
Taxonomy: cellular organisms; Bacteria; Proteobacteria; Gammaproteobacteria; Pseudomonadales; Moraxellaceae; Acinetobacter; unclassified Acinetobacter
Average proteome isoelectric point is 6.49
Get precalculated fractions of proteins

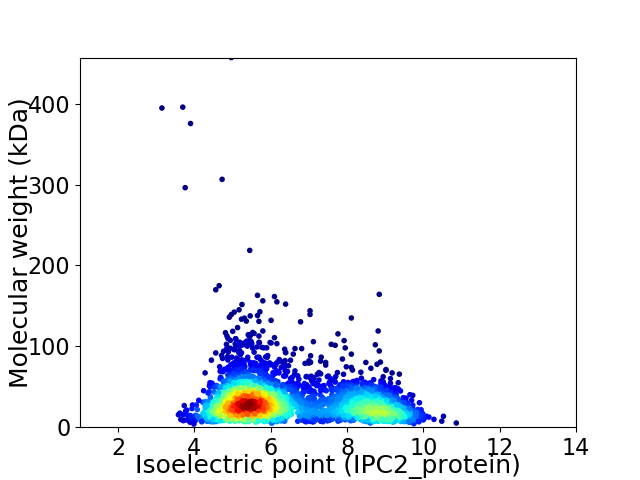
Virtual 2D-PAGE plot for 3287 proteins (isoelectric point calculated using IPC2_protein)
Get csv file with sequences according to given criteria:
* You can choose from 21 different methods for calculating isoelectric point
Summary statistics related to proteome-wise predictions


Protein with the lowest isoelectric point:
>tr|A0A143G7K6|A0A143G7K6_9GAMM Uncharacterized protein OS=Acinetobacter sp. TGL-Y2 OX=1407071 GN=AMD27_15840 PE=4 SV=1
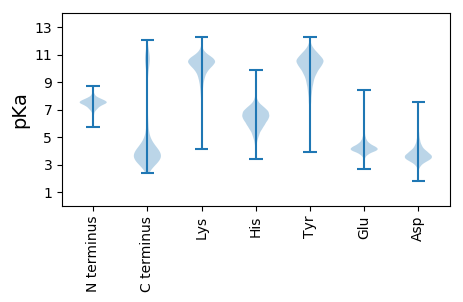
MM1 pKa = 7.3FKK3 pKa = 10.61KK4 pKa = 10.24IVLATAIIASLGTAHH19 pKa = 8.12AYY21 pKa = 7.95QAEE24 pKa = 4.34VGGTISLVDD33 pKa = 4.0PDD35 pKa = 4.75QGDD38 pKa = 3.6TSAGFAVDD46 pKa = 3.24GTYY49 pKa = 10.74YY50 pKa = 10.73FNPVQVKK57 pKa = 10.26NNPLNEE63 pKa = 3.85AAFLDD68 pKa = 3.96RR69 pKa = 11.84ASNVNGAISYY79 pKa = 10.3IDD81 pKa = 4.04YY82 pKa = 10.6DD83 pKa = 4.22LSDD86 pKa = 3.23ITTFGAGVEE95 pKa = 4.25YY96 pKa = 9.7FVPNSDD102 pKa = 4.36FYY104 pKa = 11.67VSANIGQTQLGSDD117 pKa = 3.53GSEE120 pKa = 4.21DD121 pKa = 4.14FDD123 pKa = 3.79TTTYY127 pKa = 9.99SAEE130 pKa = 4.15VGYY133 pKa = 10.68LPAPGLLVAVGLTGFDD149 pKa = 3.53NDD151 pKa = 5.1LGDD154 pKa = 5.48DD155 pKa = 3.66VDD157 pKa = 3.67PTLRR161 pKa = 11.84AKK163 pKa = 10.61YY164 pKa = 7.88VTQVGAYY171 pKa = 10.29DD172 pKa = 3.65MNFEE176 pKa = 4.13GAATFGDD183 pKa = 3.45INAYY187 pKa = 10.15GLGADD192 pKa = 4.81LYY194 pKa = 10.8LDD196 pKa = 3.4KK197 pKa = 10.74TFSVGAGFSGSDD209 pKa = 3.4ADD211 pKa = 5.42GVDD214 pKa = 3.53DD215 pKa = 5.08DD216 pKa = 4.9VFNIRR221 pKa = 11.84AKK223 pKa = 10.73KK224 pKa = 10.33FFTQQISLEE233 pKa = 4.15GSVNFADD240 pKa = 3.89AGNVFGVRR248 pKa = 11.84GAYY251 pKa = 9.79RR252 pKa = 11.84FF253 pKa = 3.58
MM1 pKa = 7.3FKK3 pKa = 10.61KK4 pKa = 10.24IVLATAIIASLGTAHH19 pKa = 8.12AYY21 pKa = 7.95QAEE24 pKa = 4.34VGGTISLVDD33 pKa = 4.0PDD35 pKa = 4.75QGDD38 pKa = 3.6TSAGFAVDD46 pKa = 3.24GTYY49 pKa = 10.74YY50 pKa = 10.73FNPVQVKK57 pKa = 10.26NNPLNEE63 pKa = 3.85AAFLDD68 pKa = 3.96RR69 pKa = 11.84ASNVNGAISYY79 pKa = 10.3IDD81 pKa = 4.04YY82 pKa = 10.6DD83 pKa = 4.22LSDD86 pKa = 3.23ITTFGAGVEE95 pKa = 4.25YY96 pKa = 9.7FVPNSDD102 pKa = 4.36FYY104 pKa = 11.67VSANIGQTQLGSDD117 pKa = 3.53GSEE120 pKa = 4.21DD121 pKa = 4.14FDD123 pKa = 3.79TTTYY127 pKa = 9.99SAEE130 pKa = 4.15VGYY133 pKa = 10.68LPAPGLLVAVGLTGFDD149 pKa = 3.53NDD151 pKa = 5.1LGDD154 pKa = 5.48DD155 pKa = 3.66VDD157 pKa = 3.67PTLRR161 pKa = 11.84AKK163 pKa = 10.61YY164 pKa = 7.88VTQVGAYY171 pKa = 10.29DD172 pKa = 3.65MNFEE176 pKa = 4.13GAATFGDD183 pKa = 3.45INAYY187 pKa = 10.15GLGADD192 pKa = 4.81LYY194 pKa = 10.8LDD196 pKa = 3.4KK197 pKa = 10.74TFSVGAGFSGSDD209 pKa = 3.4ADD211 pKa = 5.42GVDD214 pKa = 3.53DD215 pKa = 5.08DD216 pKa = 4.9VFNIRR221 pKa = 11.84AKK223 pKa = 10.73KK224 pKa = 10.33FFTQQISLEE233 pKa = 4.15GSVNFADD240 pKa = 3.89AGNVFGVRR248 pKa = 11.84GAYY251 pKa = 9.79RR252 pKa = 11.84FF253 pKa = 3.58
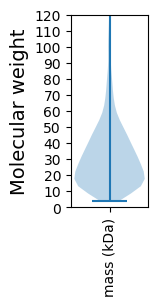
Molecular weight: 26.72 kDa
Isoelectric point according different methods:
Protein with the highest isoelectric point:
>tr|A0A143G7V6|A0A143G7V6_9GAMM Uncharacterized protein OS=Acinetobacter sp. TGL-Y2 OX=1407071 GN=AMD27_13585 PE=4 SV=1
MM1 pKa = 7.45KK2 pKa = 9.55RR3 pKa = 11.84TFQPSEE9 pKa = 3.97LKK11 pKa = 10.13RR12 pKa = 11.84KK13 pKa = 8.98RR14 pKa = 11.84VHH16 pKa = 6.36GFRR19 pKa = 11.84ARR21 pKa = 11.84MATKK25 pKa = 10.4AGRR28 pKa = 11.84QVLARR33 pKa = 11.84RR34 pKa = 11.84RR35 pKa = 11.84AKK37 pKa = 10.24GRR39 pKa = 11.84QSLTVV44 pKa = 3.17
MM1 pKa = 7.45KK2 pKa = 9.55RR3 pKa = 11.84TFQPSEE9 pKa = 3.97LKK11 pKa = 10.13RR12 pKa = 11.84KK13 pKa = 8.98RR14 pKa = 11.84VHH16 pKa = 6.36GFRR19 pKa = 11.84ARR21 pKa = 11.84MATKK25 pKa = 10.4AGRR28 pKa = 11.84QVLARR33 pKa = 11.84RR34 pKa = 11.84RR35 pKa = 11.84AKK37 pKa = 10.24GRR39 pKa = 11.84QSLTVV44 pKa = 3.17
Molecular weight: 5.17 kDa
Isoelectric point according different methods:
Peptides (in silico digests for buttom-up proteomics)
Below you can find in silico digests of the whole proteome with Trypsin, Chymotrypsin, Trypsin+LysC, LysN, ArgC proteases suitable for different mass spec machines.| Try ESI |
 |
|---|
| ChTry ESI |
 |
|---|
| ArgC ESI |
 |
|---|
| LysN ESI |
 |
|---|
| TryLysC ESI |
 |
|---|
| Try MALDI |
 |
|---|
| ChTry MALDI |
 |
|---|
| ArgC MALDI |
 |
|---|
| LysN MALDI |
 |
|---|
| TryLysC MALDI |
 |
|---|
| Try LTQ |
 |
|---|
| ChTry LTQ |
 |
|---|
| ArgC LTQ |
 |
|---|
| LysN LTQ |
 |
|---|
| TryLysC LTQ |
 |
|---|
| Try MSlow |
 |
|---|
| ChTry MSlow |
 |
|---|
| ArgC MSlow |
 |
|---|
| LysN MSlow |
 |
|---|
| TryLysC MSlow |
 |
|---|
| Try MShigh |
 |
|---|
| ChTry MShigh |
 |
|---|
| ArgC MShigh |
 |
|---|
| LysN MShigh |
 |
|---|
| TryLysC MShigh |
 |
|---|
General Statistics
Number of major isoforms |
Number of additional isoforms |
Number of all proteins |
Number of amino acids |
Min. Seq. Length |
Max. Seq. Length |
Avg. Seq. Length |
Avg. Mol. Weight |
|---|---|---|---|---|---|---|---|
0 |
989157 |
33 |
4289 |
300.9 |
33.59 |
Amino acid frequency
Ala |
Cys |
Asp |
Glu |
Phe |
Gly |
His |
Ile |
Lys |
Leu |
|---|---|---|---|---|---|---|---|---|---|
8.46 ± 0.086 | 0.94 ± 0.015 |
5.41 ± 0.048 | 5.857 ± 0.048 |
4.3 ± 0.038 | 6.37 ± 0.06 |
2.35 ± 0.033 | 7.029 ± 0.04 |
5.942 ± 0.047 | 10.227 ± 0.063 |
Met |
Asn |
Gln |
Pro |
Arg |
Ser |
Thr |
Val |
Trp |
Tyr |
|---|---|---|---|---|---|---|---|---|---|
2.515 ± 0.03 | 4.77 ± 0.053 |
3.773 ± 0.036 | 5.173 ± 0.043 |
4.147 ± 0.044 | 6.397 ± 0.043 |
5.375 ± 0.066 | 6.6 ± 0.046 |
1.173 ± 0.021 | 3.191 ± 0.031 |
Most of the basic statistics you can see at this page can be downloaded from this CSV file
Proteome-pI is available under Creative Commons Attribution-NoDerivs license, for more details see here
| Reference: Kozlowski LP. Proteome-pI 2.0: Proteome Isoelectric Point Database Update. Nucleic Acids Res. 2021, doi: 10.1093/nar/gkab944 | Contact: Lukasz P. Kozlowski |
