Wenzhou tapeworm virus 1
Taxonomy: Viruses; Riboviria; Orthornavirae; Negarnaviricota; Haploviricotina; Monjiviricetes; Mononegavirales; Nyamiviridae; Tapwovirus; Tapeworm tapwovirus
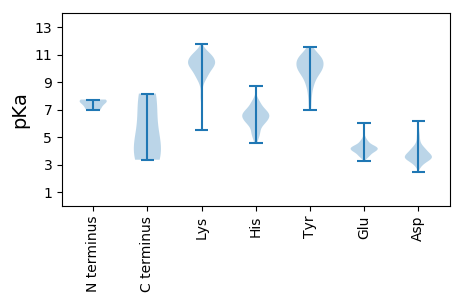
Average proteome isoelectric point is 6.34
Get precalculated fractions of proteins

Virtual 2D-PAGE plot for 5 proteins (isoelectric point calculated using IPC2_protein)
Get csv file with sequences according to given criteria:
* You can choose from 21 different methods for calculating isoelectric point
Summary statistics related to proteome-wise predictions


Protein with the lowest isoelectric point:
>tr|A0A1L3KN32|A0A1L3KN32_9MONO Putative glycoprotein OS=Wenzhou tapeworm virus 1 OX=1923661 PE=4 SV=1
MM1 pKa = 6.93STITRR6 pKa = 11.84SSKK9 pKa = 10.38RR10 pKa = 11.84SGSEE14 pKa = 3.51LSGSARR20 pKa = 11.84KK21 pKa = 7.91YY22 pKa = 9.35QRR24 pKa = 11.84YY25 pKa = 8.89NPEE28 pKa = 4.33DD29 pKa = 3.69LQEE32 pKa = 4.57GADD35 pKa = 3.83LDD37 pKa = 3.97YY38 pKa = 11.53QEE40 pKa = 4.65WQFGSHH46 pKa = 6.14GSVPTTVEE54 pKa = 3.57EE55 pKa = 4.79KK56 pKa = 10.63YY57 pKa = 10.77AALALQDD64 pKa = 3.86QEE66 pKa = 4.59STSAQGPQDD75 pKa = 3.75PATVSTTDD83 pKa = 3.52PAVQILDD90 pKa = 3.66QDD92 pKa = 4.11SSNQTPHH99 pKa = 6.78PALVVMLGRR108 pKa = 11.84IVANQEE114 pKa = 3.99RR115 pKa = 11.84IIEE118 pKa = 3.97LLQRR122 pKa = 11.84IEE124 pKa = 3.7AQQRR128 pKa = 11.84HH129 pKa = 5.21FADD132 pKa = 4.15SEE134 pKa = 4.5KK135 pKa = 11.02AWTEE139 pKa = 3.56ALNATKK145 pKa = 10.21TSLIEE150 pKa = 4.15LYY152 pKa = 9.75RR153 pKa = 11.84QSSVAIVRR161 pKa = 11.84PSQTSKK167 pKa = 10.43PAPLLQAPTATFLSNPSVADD187 pKa = 3.88ANASAFNKK195 pKa = 9.49FFF197 pKa = 4.5
MM1 pKa = 6.93STITRR6 pKa = 11.84SSKK9 pKa = 10.38RR10 pKa = 11.84SGSEE14 pKa = 3.51LSGSARR20 pKa = 11.84KK21 pKa = 7.91YY22 pKa = 9.35QRR24 pKa = 11.84YY25 pKa = 8.89NPEE28 pKa = 4.33DD29 pKa = 3.69LQEE32 pKa = 4.57GADD35 pKa = 3.83LDD37 pKa = 3.97YY38 pKa = 11.53QEE40 pKa = 4.65WQFGSHH46 pKa = 6.14GSVPTTVEE54 pKa = 3.57EE55 pKa = 4.79KK56 pKa = 10.63YY57 pKa = 10.77AALALQDD64 pKa = 3.86QEE66 pKa = 4.59STSAQGPQDD75 pKa = 3.75PATVSTTDD83 pKa = 3.52PAVQILDD90 pKa = 3.66QDD92 pKa = 4.11SSNQTPHH99 pKa = 6.78PALVVMLGRR108 pKa = 11.84IVANQEE114 pKa = 3.99RR115 pKa = 11.84IIEE118 pKa = 3.97LLQRR122 pKa = 11.84IEE124 pKa = 3.7AQQRR128 pKa = 11.84HH129 pKa = 5.21FADD132 pKa = 4.15SEE134 pKa = 4.5KK135 pKa = 11.02AWTEE139 pKa = 3.56ALNATKK145 pKa = 10.21TSLIEE150 pKa = 4.15LYY152 pKa = 9.75RR153 pKa = 11.84QSSVAIVRR161 pKa = 11.84PSQTSKK167 pKa = 10.43PAPLLQAPTATFLSNPSVADD187 pKa = 3.88ANASAFNKK195 pKa = 9.49FFF197 pKa = 4.5
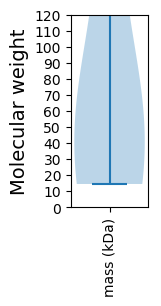
Molecular weight: 21.58 kDa
Isoelectric point according different methods:
Protein with the highest isoelectric point:
>tr|A0A1L3KN08|A0A1L3KN08_9MONO GDP polyribonucleotidyltransferase OS=Wenzhou tapeworm virus 1 OX=1923661 PE=4 SV=1
MM1 pKa = 7.65IKK3 pKa = 10.57NILRR7 pKa = 11.84DD8 pKa = 3.52SGTSILSGSVVHH20 pKa = 6.47SLGGLVSTVTGGLGVTAIYY39 pKa = 10.5KK40 pKa = 9.61KK41 pKa = 11.13VKK43 pKa = 10.33DD44 pKa = 3.44RR45 pKa = 11.84WAKK48 pKa = 9.68KK49 pKa = 10.02QEE51 pKa = 4.35AGCTTIKK58 pKa = 10.36FKK60 pKa = 11.08HH61 pKa = 5.69FTTGPDD67 pKa = 3.29GTFCICGDD75 pKa = 3.15KK76 pKa = 11.0HH77 pKa = 6.99KK78 pKa = 10.16FTGHH82 pKa = 6.65LVLLTTPGDD91 pKa = 4.02EE92 pKa = 5.01LGHH95 pKa = 6.81LPTGHH100 pKa = 5.38YY101 pKa = 9.45HH102 pKa = 5.3KK103 pKa = 10.58QAMVVCLAPQCMDD116 pKa = 3.6NNVQNPEE123 pKa = 4.19EE124 pKa = 4.4LCLLPAHH131 pKa = 7.03ASSII135 pKa = 3.95
MM1 pKa = 7.65IKK3 pKa = 10.57NILRR7 pKa = 11.84DD8 pKa = 3.52SGTSILSGSVVHH20 pKa = 6.47SLGGLVSTVTGGLGVTAIYY39 pKa = 10.5KK40 pKa = 9.61KK41 pKa = 11.13VKK43 pKa = 10.33DD44 pKa = 3.44RR45 pKa = 11.84WAKK48 pKa = 9.68KK49 pKa = 10.02QEE51 pKa = 4.35AGCTTIKK58 pKa = 10.36FKK60 pKa = 11.08HH61 pKa = 5.69FTTGPDD67 pKa = 3.29GTFCICGDD75 pKa = 3.15KK76 pKa = 11.0HH77 pKa = 6.99KK78 pKa = 10.16FTGHH82 pKa = 6.65LVLLTTPGDD91 pKa = 4.02EE92 pKa = 5.01LGHH95 pKa = 6.81LPTGHH100 pKa = 5.38YY101 pKa = 9.45HH102 pKa = 5.3KK103 pKa = 10.58QAMVVCLAPQCMDD116 pKa = 3.6NNVQNPEE123 pKa = 4.19EE124 pKa = 4.4LCLLPAHH131 pKa = 7.03ASSII135 pKa = 3.95
Molecular weight: 14.44 kDa
Isoelectric point according different methods:
Peptides (in silico digests for buttom-up proteomics)
Below you can find in silico digests of the whole proteome with Trypsin, Chymotrypsin, Trypsin+LysC, LysN, ArgC proteases suitable for different mass spec machines.| Try ESI |
 |
|---|
| ChTry ESI |
 |
|---|
| ArgC ESI |
 |
|---|
| LysN ESI |
 |
|---|
| TryLysC ESI |
 |
|---|
| Try MALDI |
 |
|---|
| ChTry MALDI |
 |
|---|
| ArgC MALDI |
 |
|---|
| LysN MALDI |
 |
|---|
| TryLysC MALDI |
 |
|---|
| Try LTQ |
 |
|---|
| ChTry LTQ |
 |
|---|
| ArgC LTQ |
 |
|---|
| LysN LTQ |
 |
|---|
| TryLysC LTQ |
 |
|---|
| Try MSlow |
 |
|---|
| ChTry MSlow |
 |
|---|
| ArgC MSlow |
 |
|---|
| LysN MSlow |
 |
|---|
| TryLysC MSlow |
 |
|---|
| Try MShigh |
 |
|---|
| ChTry MShigh |
 |
|---|
| ArgC MShigh |
 |
|---|
| LysN MShigh |
 |
|---|
| TryLysC MShigh |
 |
|---|
General Statistics
Number of major isoforms |
Number of additional isoforms |
Number of all proteins |
Number of amino acids |
Min. Seq. Length |
Max. Seq. Length |
Avg. Seq. Length |
Avg. Mol. Weight |
|---|---|---|---|---|---|---|---|
0 |
3448 |
135 |
1961 |
689.6 |
77.87 |
Amino acid frequency
Ala |
Cys |
Asp |
Glu |
Phe |
Gly |
His |
Ile |
Lys |
Leu |
|---|---|---|---|---|---|---|---|---|---|
6.874 ± 0.671 | 2.001 ± 0.305 |
5.191 ± 0.294 | 5.626 ± 0.231 |
3.77 ± 0.323 | 5.307 ± 0.469 |
2.958 ± 0.285 | 5.916 ± 0.394 |
3.944 ± 0.457 | 10.267 ± 0.898 |
Met |
Asn |
Gln |
Pro |
Arg |
Ser |
Thr |
Val |
Trp |
Tyr |
|---|---|---|---|---|---|---|---|---|---|
2.552 ± 0.349 | 3.248 ± 0.174 |
5.8 ± 0.461 | 3.828 ± 0.607 |
6.497 ± 0.572 | 7.831 ± 0.591 |
6.061 ± 0.607 | 6.932 ± 0.941 |
1.508 ± 0.397 | 3.886 ± 0.489 |
Most of the basic statistics you can see at this page can be downloaded from this CSV file
Proteome-pI is available under Creative Commons Attribution-NoDerivs license, for more details see here
| Reference: Kozlowski LP. Proteome-pI 2.0: Proteome Isoelectric Point Database Update. Nucleic Acids Res. 2021, doi: 10.1093/nar/gkab944 | Contact: Lukasz P. Kozlowski |
