Vibrio sp. V15_P4S5T153
Taxonomy: cellular organisms; Bacteria; Proteobacteria; Gammaproteobacteria; Vibrionales; Vibrionaceae; Vibrio; unclassified Vibrio
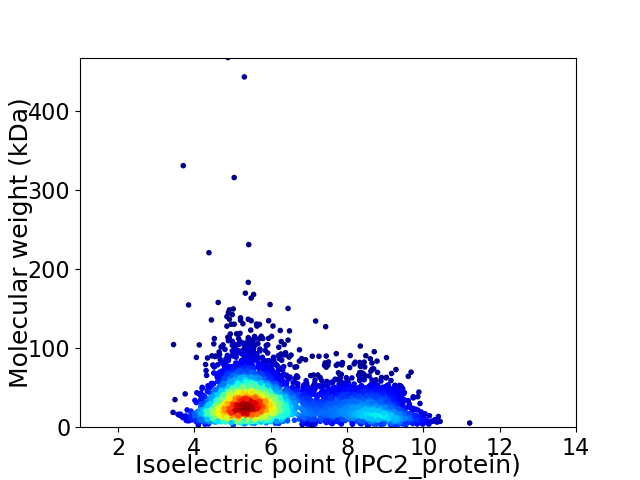
Average proteome isoelectric point is 6.22
Get precalculated fractions of proteins

Virtual 2D-PAGE plot for 4788 proteins (isoelectric point calculated using IPC2_protein)
Get csv file with sequences according to given criteria:
* You can choose from 21 different methods for calculating isoelectric point
Summary statistics related to proteome-wise predictions


Protein with the lowest isoelectric point:
>tr|A0A233HUU0|A0A233HUU0_9VIBR Uncharacterized protein OS=Vibrio sp. V15_P4S5T153 OX=1938669 GN=B9J89_04680 PE=4 SV=1
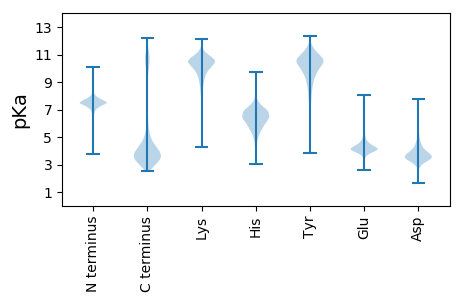
MM1 pKa = 7.42KK2 pKa = 10.38KK3 pKa = 10.28VLLTLAVSAAFSSQAFSATTFDD25 pKa = 3.53ARR27 pKa = 11.84SVGMGGIGVSTSNYY41 pKa = 10.02LMAPFHH47 pKa = 6.44NPALVAKK54 pKa = 9.97YY55 pKa = 10.49GDD57 pKa = 3.8SDD59 pKa = 4.11DD60 pKa = 4.8VGILLPSIGVNLQDD74 pKa = 3.75KK75 pKa = 11.24GEE77 pKa = 4.13MVDD80 pKa = 4.96GIDD83 pKa = 4.05SAVDD87 pKa = 4.0AIDD90 pKa = 4.0ALEE93 pKa = 4.32ANRR96 pKa = 11.84TQQNASNVVDD106 pKa = 5.09ALAALNRR113 pKa = 11.84DD114 pKa = 3.21SAYY117 pKa = 9.64VQAGVGMAVAIPNQLVSVNLFTQGYY142 pKa = 9.52ADD144 pKa = 3.63AFVYY148 pKa = 10.93ADD150 pKa = 3.94VADD153 pKa = 3.99SDD155 pKa = 4.71LNEE158 pKa = 4.42SEE160 pKa = 4.98LLNPSHH166 pKa = 6.94TYY168 pKa = 11.11DD169 pKa = 3.04STATVAGIAVVEE181 pKa = 5.33FGAALAKK188 pKa = 10.05EE189 pKa = 4.32YY190 pKa = 10.8KK191 pKa = 10.33LEE193 pKa = 4.16NSVIYY198 pKa = 10.74YY199 pKa = 10.72GLTPKK204 pKa = 9.91IQQVKK209 pKa = 8.03TINYY213 pKa = 8.67VADD216 pKa = 3.38INNFEE221 pKa = 4.47FDD223 pKa = 5.62DD224 pKa = 4.06MTDD227 pKa = 3.28DD228 pKa = 3.8QYY230 pKa = 12.14QNSEE234 pKa = 3.95TSFNLDD240 pKa = 2.69AGVAYY245 pKa = 9.57TMNNGLSLGLVGRR258 pKa = 11.84NLISQSYY265 pKa = 8.38DD266 pKa = 3.12TVEE269 pKa = 3.95LDD271 pKa = 3.72GVKK274 pKa = 10.34ASYY277 pKa = 10.4SINPVFVASASYY289 pKa = 9.62NYY291 pKa = 10.76SWFTVGADD299 pKa = 3.0IEE301 pKa = 4.54LNEE304 pKa = 4.24TEE306 pKa = 4.67RR307 pKa = 11.84FEE309 pKa = 5.47DD310 pKa = 3.07MSGFMNSIDD319 pKa = 3.64SSSDD323 pKa = 3.0NTQLAGIGIEE333 pKa = 4.08LNAWDD338 pKa = 4.08WAQLRR343 pKa = 11.84AGYY346 pKa = 8.02QTDD349 pKa = 3.15IANNLDD355 pKa = 3.56DD356 pKa = 4.85QFTAGIGLSPFGTVRR371 pKa = 11.84IDD373 pKa = 3.62LAGSYY378 pKa = 10.24AGEE381 pKa = 4.1NQLGVSLQTSMTFF394 pKa = 3.14
MM1 pKa = 7.42KK2 pKa = 10.38KK3 pKa = 10.28VLLTLAVSAAFSSQAFSATTFDD25 pKa = 3.53ARR27 pKa = 11.84SVGMGGIGVSTSNYY41 pKa = 10.02LMAPFHH47 pKa = 6.44NPALVAKK54 pKa = 9.97YY55 pKa = 10.49GDD57 pKa = 3.8SDD59 pKa = 4.11DD60 pKa = 4.8VGILLPSIGVNLQDD74 pKa = 3.75KK75 pKa = 11.24GEE77 pKa = 4.13MVDD80 pKa = 4.96GIDD83 pKa = 4.05SAVDD87 pKa = 4.0AIDD90 pKa = 4.0ALEE93 pKa = 4.32ANRR96 pKa = 11.84TQQNASNVVDD106 pKa = 5.09ALAALNRR113 pKa = 11.84DD114 pKa = 3.21SAYY117 pKa = 9.64VQAGVGMAVAIPNQLVSVNLFTQGYY142 pKa = 9.52ADD144 pKa = 3.63AFVYY148 pKa = 10.93ADD150 pKa = 3.94VADD153 pKa = 3.99SDD155 pKa = 4.71LNEE158 pKa = 4.42SEE160 pKa = 4.98LLNPSHH166 pKa = 6.94TYY168 pKa = 11.11DD169 pKa = 3.04STATVAGIAVVEE181 pKa = 5.33FGAALAKK188 pKa = 10.05EE189 pKa = 4.32YY190 pKa = 10.8KK191 pKa = 10.33LEE193 pKa = 4.16NSVIYY198 pKa = 10.74YY199 pKa = 10.72GLTPKK204 pKa = 9.91IQQVKK209 pKa = 8.03TINYY213 pKa = 8.67VADD216 pKa = 3.38INNFEE221 pKa = 4.47FDD223 pKa = 5.62DD224 pKa = 4.06MTDD227 pKa = 3.28DD228 pKa = 3.8QYY230 pKa = 12.14QNSEE234 pKa = 3.95TSFNLDD240 pKa = 2.69AGVAYY245 pKa = 9.57TMNNGLSLGLVGRR258 pKa = 11.84NLISQSYY265 pKa = 8.38DD266 pKa = 3.12TVEE269 pKa = 3.95LDD271 pKa = 3.72GVKK274 pKa = 10.34ASYY277 pKa = 10.4SINPVFVASASYY289 pKa = 9.62NYY291 pKa = 10.76SWFTVGADD299 pKa = 3.0IEE301 pKa = 4.54LNEE304 pKa = 4.24TEE306 pKa = 4.67RR307 pKa = 11.84FEE309 pKa = 5.47DD310 pKa = 3.07MSGFMNSIDD319 pKa = 3.64SSSDD323 pKa = 3.0NTQLAGIGIEE333 pKa = 4.08LNAWDD338 pKa = 4.08WAQLRR343 pKa = 11.84AGYY346 pKa = 8.02QTDD349 pKa = 3.15IANNLDD355 pKa = 3.56DD356 pKa = 4.85QFTAGIGLSPFGTVRR371 pKa = 11.84IDD373 pKa = 3.62LAGSYY378 pKa = 10.24AGEE381 pKa = 4.1NQLGVSLQTSMTFF394 pKa = 3.14
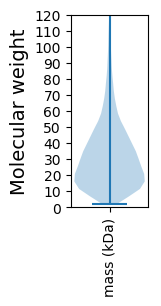
Molecular weight: 42.07 kDa
Isoelectric point according different methods:
Protein with the highest isoelectric point:
>tr|A0A233HQP0|A0A233HQP0_9VIBR Uncharacterized protein OS=Vibrio sp. V15_P4S5T153 OX=1938669 GN=B9J89_06075 PE=4 SV=1
MM1 pKa = 7.69SKK3 pKa = 8.99RR4 pKa = 11.84TFQPTVLKK12 pKa = 10.46RR13 pKa = 11.84KK14 pKa = 7.65RR15 pKa = 11.84THH17 pKa = 5.89GFRR20 pKa = 11.84ARR22 pKa = 11.84MATKK26 pKa = 10.44NGRR29 pKa = 11.84KK30 pKa = 9.39VINARR35 pKa = 11.84RR36 pKa = 11.84AKK38 pKa = 10.22GRR40 pKa = 11.84ARR42 pKa = 11.84LSKK45 pKa = 10.83
MM1 pKa = 7.69SKK3 pKa = 8.99RR4 pKa = 11.84TFQPTVLKK12 pKa = 10.46RR13 pKa = 11.84KK14 pKa = 7.65RR15 pKa = 11.84THH17 pKa = 5.89GFRR20 pKa = 11.84ARR22 pKa = 11.84MATKK26 pKa = 10.44NGRR29 pKa = 11.84KK30 pKa = 9.39VINARR35 pKa = 11.84RR36 pKa = 11.84AKK38 pKa = 10.22GRR40 pKa = 11.84ARR42 pKa = 11.84LSKK45 pKa = 10.83
Molecular weight: 5.27 kDa
Isoelectric point according different methods:
Peptides (in silico digests for buttom-up proteomics)
Below you can find in silico digests of the whole proteome with Trypsin, Chymotrypsin, Trypsin+LysC, LysN, ArgC proteases suitable for different mass spec machines.| Try ESI |
 |
|---|
| ChTry ESI |
 |
|---|
| ArgC ESI |
 |
|---|
| LysN ESI |
 |
|---|
| TryLysC ESI |
 |
|---|
| Try MALDI |
 |
|---|
| ChTry MALDI |
 |
|---|
| ArgC MALDI |
 |
|---|
| LysN MALDI |
 |
|---|
| TryLysC MALDI |
 |
|---|
| Try LTQ |
 |
|---|
| ChTry LTQ |
 |
|---|
| ArgC LTQ |
 |
|---|
| LysN LTQ |
 |
|---|
| TryLysC LTQ |
 |
|---|
| Try MSlow |
 |
|---|
| ChTry MSlow |
 |
|---|
| ArgC MSlow |
 |
|---|
| LysN MSlow |
 |
|---|
| TryLysC MSlow |
 |
|---|
| Try MShigh |
 |
|---|
| ChTry MShigh |
 |
|---|
| ArgC MShigh |
 |
|---|
| LysN MShigh |
 |
|---|
| TryLysC MShigh |
 |
|---|
General Statistics
Number of major isoforms |
Number of additional isoforms |
Number of all proteins |
Number of amino acids |
Min. Seq. Length |
Max. Seq. Length |
Avg. Seq. Length |
Avg. Mol. Weight |
|---|---|---|---|---|---|---|---|
0 |
1438149 |
19 |
4401 |
300.4 |
33.54 |
Amino acid frequency
Ala |
Cys |
Asp |
Glu |
Phe |
Gly |
His |
Ile |
Lys |
Leu |
|---|---|---|---|---|---|---|---|---|---|
8.278 ± 0.043 | 1.112 ± 0.012 |
5.417 ± 0.029 | 6.417 ± 0.039 |
4.182 ± 0.025 | 6.436 ± 0.037 |
2.354 ± 0.019 | 6.535 ± 0.029 |
5.717 ± 0.038 | 10.368 ± 0.043 |
Met |
Asn |
Gln |
Pro |
Arg |
Ser |
Thr |
Val |
Trp |
Tyr |
|---|---|---|---|---|---|---|---|---|---|
2.659 ± 0.019 | 4.443 ± 0.026 |
3.693 ± 0.025 | 4.686 ± 0.037 |
4.496 ± 0.028 | 6.835 ± 0.032 |
5.171 ± 0.022 | 6.821 ± 0.03 |
1.206 ± 0.015 | 3.174 ± 0.02 |
Most of the basic statistics you can see at this page can be downloaded from this CSV file
Proteome-pI is available under Creative Commons Attribution-NoDerivs license, for more details see here
| Reference: Kozlowski LP. Proteome-pI 2.0: Proteome Isoelectric Point Database Update. Nucleic Acids Res. 2021, doi: 10.1093/nar/gkab944 | Contact: Lukasz P. Kozlowski |
