Vibrio phage pTD1
Taxonomy: Viruses; Duplodnaviria; Heunggongvirae; Uroviricota; Caudoviricetes; Caudovirales; Myoviridae; Gorgonvirinae; Tidunavirus; Vibrio virus pTD1
Average proteome isoelectric point is 5.84
Get precalculated fractions of proteins
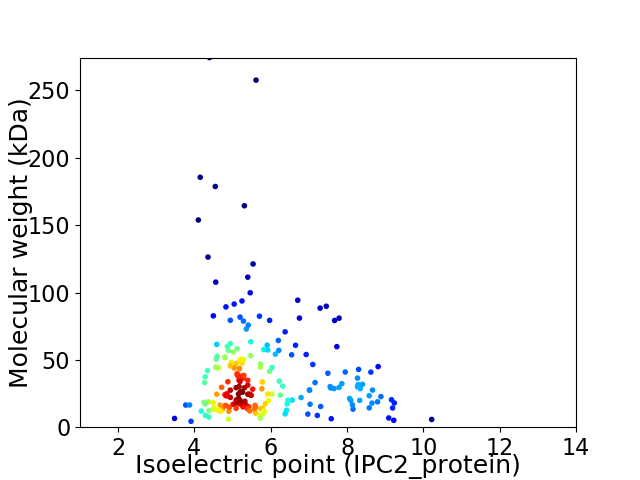
Virtual 2D-PAGE plot for 209 proteins (isoelectric point calculated using IPC2_protein)
Get csv file with sequences according to given criteria:
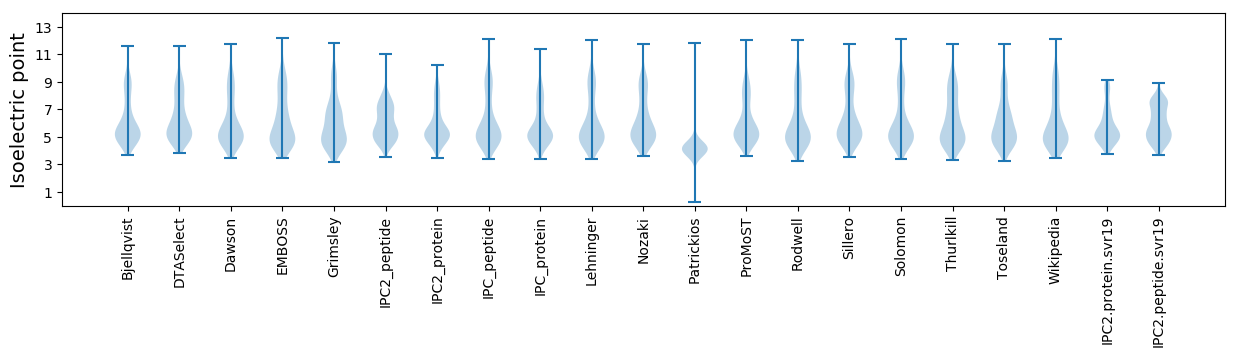
* You can choose from 21 different methods for calculating isoelectric point
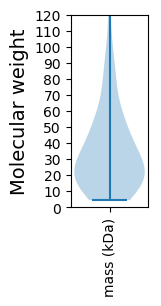
Summary statistics related to proteome-wise predictions
Protein with the lowest isoelectric point:
>tr|A0A1Q2U301|A0A1Q2U301_9CAUD Phage protein OS=Vibrio phage pTD1 OX=1938577 PE=4 SV=1
MM1 pKa = 7.28FVTIHH6 pKa = 6.77HH7 pKa = 7.35EE8 pKa = 4.0DD9 pKa = 3.69TEE11 pKa = 4.42EE12 pKa = 4.84CDD14 pKa = 3.39EE15 pKa = 4.52DD16 pKa = 4.42TFSDD20 pKa = 4.3GADD23 pKa = 3.06GGFYY27 pKa = 10.11RR28 pKa = 11.84ASPADD33 pKa = 3.77PFHH36 pKa = 7.1WDD38 pKa = 2.81
MM1 pKa = 7.28FVTIHH6 pKa = 6.77HH7 pKa = 7.35EE8 pKa = 4.0DD9 pKa = 3.69TEE11 pKa = 4.42EE12 pKa = 4.84CDD14 pKa = 3.39EE15 pKa = 4.52DD16 pKa = 4.42TFSDD20 pKa = 4.3GADD23 pKa = 3.06GGFYY27 pKa = 10.11RR28 pKa = 11.84ASPADD33 pKa = 3.77PFHH36 pKa = 7.1WDD38 pKa = 2.81
Molecular weight: 4.35 kDa
Isoelectric point according different methods:
Protein with the highest isoelectric point:
>tr|A0A1Q2U2P9|A0A1Q2U2P9_9CAUD Phage protein OS=Vibrio phage pTD1 OX=1938577 PE=4 SV=1
MM1 pKa = 7.5KK2 pKa = 10.25KK3 pKa = 10.03KK4 pKa = 10.21KK5 pKa = 8.8QRR7 pKa = 11.84KK8 pKa = 8.55KK9 pKa = 8.81EE10 pKa = 3.91KK11 pKa = 10.06KK12 pKa = 8.03RR13 pKa = 11.84QKK15 pKa = 10.01EE16 pKa = 3.8AALVLAKK23 pKa = 9.13FQPNPGMILTPTQRR37 pKa = 11.84ALHH40 pKa = 6.22LSMVNPTRR48 pKa = 11.84FF49 pKa = 3.07
MM1 pKa = 7.5KK2 pKa = 10.25KK3 pKa = 10.03KK4 pKa = 10.21KK5 pKa = 8.8QRR7 pKa = 11.84KK8 pKa = 8.55KK9 pKa = 8.81EE10 pKa = 3.91KK11 pKa = 10.06KK12 pKa = 8.03RR13 pKa = 11.84QKK15 pKa = 10.01EE16 pKa = 3.8AALVLAKK23 pKa = 9.13FQPNPGMILTPTQRR37 pKa = 11.84ALHH40 pKa = 6.22LSMVNPTRR48 pKa = 11.84FF49 pKa = 3.07
Molecular weight: 5.75 kDa
Isoelectric point according different methods:
Peptides (in silico digests for buttom-up proteomics)
Below you can find in silico digests of the whole proteome with Trypsin, Chymotrypsin, Trypsin+LysC, LysN, ArgC proteases suitable for different mass spec machines.| Try ESI |
 |
|---|
| ChTry ESI |
|
|---|
| ArgC ESI |
|
|---|
| LysN ESI |
|
|---|
| TryLysC ESI |
|
|---|
| Try MALDI |
|
|---|
| ChTry MALDI |
|
|---|
| ArgC MALDI |
|
|---|
| LysN MALDI |
|
|---|
| TryLysC MALDI |
|
|---|
| Try LTQ |
|
|---|
| ChTry LTQ |
|
|---|
| ArgC LTQ |
|
|---|
| LysN LTQ |
|
|---|
| TryLysC LTQ |
|
|---|
| Try MSlow |
|
|---|
| ChTry MSlow |
|
|---|
| ArgC MSlow |
|
|---|
| LysN MSlow |
|
|---|
| TryLysC MSlow |
|
|---|
| Try MShigh |
|
|---|
| ChTry MShigh |
|
|---|
| ArgC MShigh |
|
|---|
| LysN MShigh |
|
|---|
| TryLysC MShigh |
|
|---|
General Statistics
Number of major isoforms |
Number of additional isoforms |
Number of all proteins |
Number of amino acids |
Min. Seq. Length |
Max. Seq. Length |
Avg. Seq. Length |
Avg. Mol. Weight |
|---|---|---|---|---|---|---|---|
0 |
74130 |
38 |
2486 |
354.7 |
40.08 |
Amino acid frequency
Ala |
Cys |
Asp |
Glu |
Phe |
Gly |
His |
Ile |
Lys |
Leu |
|---|---|---|---|---|---|---|---|---|---|
6.146 ± 0.164 | 0.812 ± 0.059 |
6.501 ± 0.106 | 7.306 ± 0.15 |
4.145 ± 0.078 | 6.486 ± 0.2 |
2.202 ± 0.095 | 5.787 ± 0.129 |
5.887 ± 0.186 | 8.955 ± 0.174 |
Met |
Asn |
Gln |
Pro |
Arg |
Ser |
Thr |
Val |
Trp |
Tyr |
|---|---|---|---|---|---|---|---|---|---|
2.853 ± 0.092 | 5.152 ± 0.1 |
4.109 ± 0.118 | 3.379 ± 0.094 |
4.995 ± 0.154 | 6.089 ± 0.104 |
6.912 ± 0.205 | 7.116 ± 0.207 |
1.167 ± 0.053 | 4.001 ± 0.115 |
Most of the basic statistics you can see at this page can be downloaded from this CSV file
See this proteome in:

Proteome-pI is available under Creative Commons Attribution-NoDerivs license, for more details see here
| Reference: Kozlowski LP. Proteome-pI 2.0: Proteome Isoelectric Point Database Update. Nucleic Acids Res. 2021, doi: 10.1093/nar/gkab944 | Contact: Lukasz P. Kozlowski |