Actinoplanes awajinensis subsp. mycoplanecinus
Taxonomy: cellular organisms; Bacteria; Terrabacteria group; Actinobacteria; Actinomycetia; Micromonosporales; Micromonosporaceae; Actinoplanes; Actinoplanes awajinensis
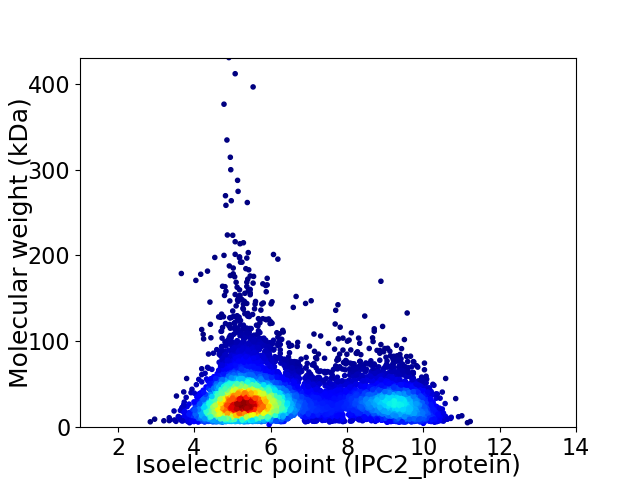
Average proteome isoelectric point is 6.42
Get precalculated fractions of proteins

Virtual 2D-PAGE plot for 9641 proteins (isoelectric point calculated using IPC2_protein)
Get csv file with sequences according to given criteria:
* You can choose from 21 different methods for calculating isoelectric point
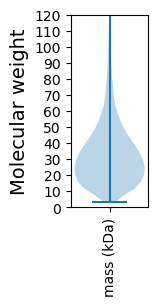
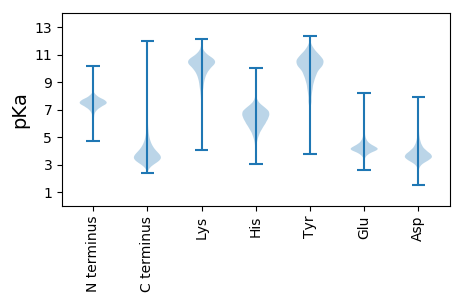
Summary statistics related to proteome-wise predictions


Protein with the lowest isoelectric point:
>tr|A0A101JTP2|A0A101JTP2_9ACTN Uncharacterized protein OS=Actinoplanes awajinensis subsp. mycoplanecinus OX=135947 GN=ADL15_19070 PE=4 SV=1
MM1 pKa = 7.04TRR3 pKa = 11.84AGLASIAVTALVLAGASSPVWAATPAMTLSSVTGPSGGGTIITGTVASPFVVFPAGTTPAVQFQYY68 pKa = 11.13VGTGSTTCSATAGAVAQIAVTGTTGTDD95 pKa = 3.4GVQTVDD101 pKa = 3.21PDD103 pKa = 3.28QVRR106 pKa = 11.84RR107 pKa = 11.84VSATKK112 pKa = 10.65VLFTVPSQAYY122 pKa = 8.36PVIGEE127 pKa = 4.54DD128 pKa = 4.86GYY130 pKa = 10.32PSTINPTGVVLAGAQTWAKK149 pKa = 10.1WNVCVYY155 pKa = 9.47DD156 pKa = 3.52TDD158 pKa = 4.1STVSSTLLATASYY171 pKa = 9.48TVTARR176 pKa = 11.84PTITSIIPASSPAGGGQSITVNGTGFSAVTTATTGAIGDD215 pKa = 3.98VPLVDD220 pKa = 4.61IKK222 pKa = 11.09VAPNGNSLTATTGPRR237 pKa = 11.84ASGTGLALTLTTPGGTVSSLDD258 pKa = 4.08PDD260 pKa = 4.92NNDD263 pKa = 3.17QPEE266 pKa = 4.33DD267 pKa = 4.2ADD269 pKa = 4.83PDD271 pKa = 3.91TDD273 pKa = 3.8DD274 pKa = 4.68APIGFLYY281 pKa = 11.09SNGITIAPRR290 pKa = 11.84TAPAGTTVVVDD301 pKa = 3.36VNGAGFSGLSFSAAGDD317 pKa = 3.76PQSTQAHH324 pKa = 5.22VFLVRR329 pKa = 11.84DD330 pKa = 4.28AYY332 pKa = 11.49VLDD335 pKa = 4.04SNRR338 pKa = 11.84GVAEE342 pKa = 4.24CVVQAVIGDD351 pKa = 3.9TEE353 pKa = 5.11LICTLDD359 pKa = 3.76LSADD363 pKa = 3.78QLSLTDD369 pKa = 4.2SSTLPSTPITDD380 pKa = 3.31GAYY383 pKa = 10.32FLTVVADD390 pKa = 4.66GSTTALNPNSSIVSSGAAFIVAPYY414 pKa = 10.27
MM1 pKa = 7.04TRR3 pKa = 11.84AGLASIAVTALVLAGASSPVWAATPAMTLSSVTGPSGGGTIITGTVASPFVVFPAGTTPAVQFQYY68 pKa = 11.13VGTGSTTCSATAGAVAQIAVTGTTGTDD95 pKa = 3.4GVQTVDD101 pKa = 3.21PDD103 pKa = 3.28QVRR106 pKa = 11.84RR107 pKa = 11.84VSATKK112 pKa = 10.65VLFTVPSQAYY122 pKa = 8.36PVIGEE127 pKa = 4.54DD128 pKa = 4.86GYY130 pKa = 10.32PSTINPTGVVLAGAQTWAKK149 pKa = 10.1WNVCVYY155 pKa = 9.47DD156 pKa = 3.52TDD158 pKa = 4.1STVSSTLLATASYY171 pKa = 9.48TVTARR176 pKa = 11.84PTITSIIPASSPAGGGQSITVNGTGFSAVTTATTGAIGDD215 pKa = 3.98VPLVDD220 pKa = 4.61IKK222 pKa = 11.09VAPNGNSLTATTGPRR237 pKa = 11.84ASGTGLALTLTTPGGTVSSLDD258 pKa = 4.08PDD260 pKa = 4.92NNDD263 pKa = 3.17QPEE266 pKa = 4.33DD267 pKa = 4.2ADD269 pKa = 4.83PDD271 pKa = 3.91TDD273 pKa = 3.8DD274 pKa = 4.68APIGFLYY281 pKa = 11.09SNGITIAPRR290 pKa = 11.84TAPAGTTVVVDD301 pKa = 3.36VNGAGFSGLSFSAAGDD317 pKa = 3.76PQSTQAHH324 pKa = 5.22VFLVRR329 pKa = 11.84DD330 pKa = 4.28AYY332 pKa = 11.49VLDD335 pKa = 4.04SNRR338 pKa = 11.84GVAEE342 pKa = 4.24CVVQAVIGDD351 pKa = 3.9TEE353 pKa = 5.11LICTLDD359 pKa = 3.76LSADD363 pKa = 3.78QLSLTDD369 pKa = 4.2SSTLPSTPITDD380 pKa = 3.31GAYY383 pKa = 10.32FLTVVADD390 pKa = 4.66GSTTALNPNSSIVSSGAAFIVAPYY414 pKa = 10.27
Molecular weight: 41.09 kDa
Isoelectric point according different methods:
Protein with the highest isoelectric point:
>tr|A0A101JH42|A0A101JH42_9ACTN Polysaccharide deacetylase OS=Actinoplanes awajinensis subsp. mycoplanecinus OX=135947 GN=ADL15_37445 PE=4 SV=1
MM1 pKa = 7.56RR2 pKa = 11.84AIASGSHH9 pKa = 5.01SWRR12 pKa = 11.84GSSLSMRR19 pKa = 11.84AHH21 pKa = 6.09GRR23 pKa = 11.84LGSLLLMRR31 pKa = 11.84AHH33 pKa = 6.56GRR35 pKa = 11.84LGSLLLMRR43 pKa = 11.84GRR45 pKa = 11.84SRR47 pKa = 11.84RR48 pKa = 11.84GNSLPMGGVVRR59 pKa = 11.84MSGG62 pKa = 2.9
MM1 pKa = 7.56RR2 pKa = 11.84AIASGSHH9 pKa = 5.01SWRR12 pKa = 11.84GSSLSMRR19 pKa = 11.84AHH21 pKa = 6.09GRR23 pKa = 11.84LGSLLLMRR31 pKa = 11.84AHH33 pKa = 6.56GRR35 pKa = 11.84LGSLLLMRR43 pKa = 11.84GRR45 pKa = 11.84SRR47 pKa = 11.84RR48 pKa = 11.84GNSLPMGGVVRR59 pKa = 11.84MSGG62 pKa = 2.9
Molecular weight: 6.64 kDa
Isoelectric point according different methods:
Peptides (in silico digests for buttom-up proteomics)
Below you can find in silico digests of the whole proteome with Trypsin, Chymotrypsin, Trypsin+LysC, LysN, ArgC proteases suitable for different mass spec machines.| Try ESI |
 |
|---|
| ChTry ESI |
 |
|---|
| ArgC ESI |
 |
|---|
| LysN ESI |
 |
|---|
| TryLysC ESI |
 |
|---|
| Try MALDI |
 |
|---|
| ChTry MALDI |
 |
|---|
| ArgC MALDI |
 |
|---|
| LysN MALDI |
 |
|---|
| TryLysC MALDI |
 |
|---|
| Try LTQ |
 |
|---|
| ChTry LTQ |
 |
|---|
| ArgC LTQ |
 |
|---|
| LysN LTQ |
 |
|---|
| TryLysC LTQ |
 |
|---|
| Try MSlow |
 |
|---|
| ChTry MSlow |
 |
|---|
| ArgC MSlow |
 |
|---|
| LysN MSlow |
 |
|---|
| TryLysC MSlow |
 |
|---|
| Try MShigh |
 |
|---|
| ChTry MShigh |
 |
|---|
| ArgC MShigh |
 |
|---|
| LysN MShigh |
 |
|---|
| TryLysC MShigh |
 |
|---|
General Statistics
Number of major isoforms |
Number of additional isoforms |
Number of all proteins |
Number of amino acids |
Min. Seq. Length |
Max. Seq. Length |
Avg. Seq. Length |
Avg. Mol. Weight |
|---|---|---|---|---|---|---|---|
0 |
3188279 |
29 |
4165 |
330.7 |
35.28 |
Amino acid frequency
Ala |
Cys |
Asp |
Glu |
Phe |
Gly |
His |
Ile |
Lys |
Leu |
|---|---|---|---|---|---|---|---|---|---|
14.035 ± 0.038 | 0.697 ± 0.006 |
6.025 ± 0.02 | 4.878 ± 0.025 |
2.779 ± 0.016 | 9.284 ± 0.024 |
2.136 ± 0.011 | 3.619 ± 0.017 |
1.881 ± 0.019 | 10.542 ± 0.036 |
Met |
Asn |
Gln |
Pro |
Arg |
Ser |
Thr |
Val |
Trp |
Tyr |
|---|---|---|---|---|---|---|---|---|---|
1.699 ± 0.01 | 1.902 ± 0.017 |
6.0 ± 0.024 | 2.855 ± 0.015 |
7.756 ± 0.031 | 5.042 ± 0.022 |
6.56 ± 0.031 | 8.649 ± 0.021 |
1.591 ± 0.011 | 2.072 ± 0.014 |
Most of the basic statistics you can see at this page can be downloaded from this CSV file
Proteome-pI is available under Creative Commons Attribution-NoDerivs license, for more details see here
| Reference: Kozlowski LP. Proteome-pI 2.0: Proteome Isoelectric Point Database Update. Nucleic Acids Res. 2021, doi: 10.1093/nar/gkab944 | Contact: Lukasz P. Kozlowski |
