Apaloderma vittatum (Bar-tailed trogon)
Taxonomy: cellular organisms; Eukaryota; Opisthokonta; Metazoa; Eumetazoa; Bilateria; Deuterostomia; Chordata; Craniata; Vertebrata; Gnathostomata; Teleostomi; Euteleostomi; Sarcopterygii; Dipnotetrapodomorpha; Tetrapoda; Amniota; Sauropsida; Sauria; Archelosauria; Archosauria; Di
Average proteome isoelectric point is 6.65
Get precalculated fractions of proteins
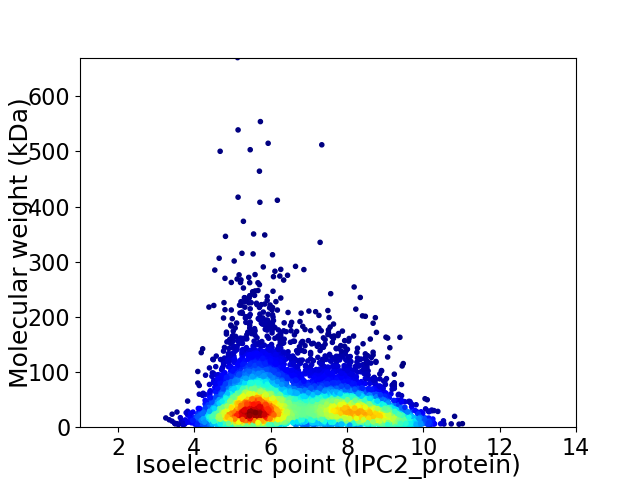
Virtual 2D-PAGE plot for 7903 proteins (isoelectric point calculated using IPC2_protein)
Get csv file with sequences according to given criteria:
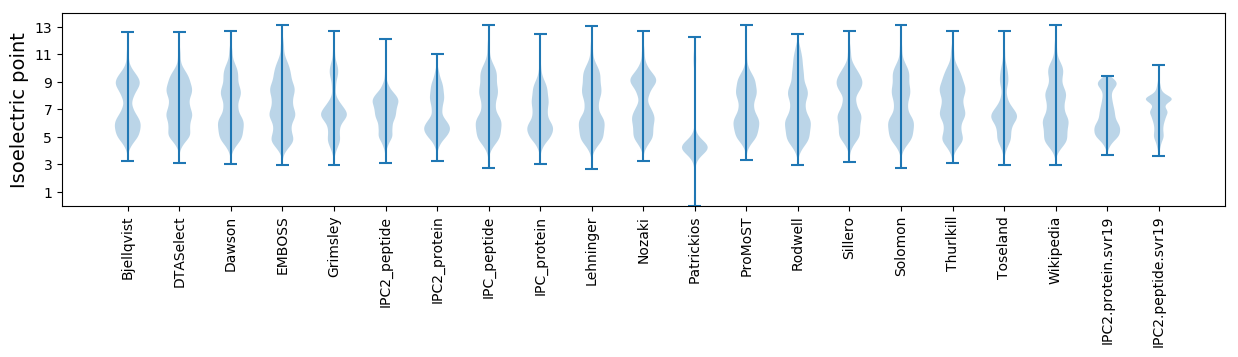
* You can choose from 21 different methods for calculating isoelectric point
Summary statistics related to proteome-wise predictions
Protein with the lowest isoelectric point:
>tr|A0A091NNV1|A0A091NNV1_APAVI Uncharacterized protein (Fragment) OS=Apaloderma vittatum OX=57397 GN=N311_05124 PE=4 SV=1
SS1 pKa = 7.12RR2 pKa = 11.84LTWLEE7 pKa = 3.51NSGVGFSLDD16 pKa = 3.46YY17 pKa = 9.24PTISLHH23 pKa = 6.08AVSRR27 pKa = 11.84DD28 pKa = 3.0LSAYY32 pKa = 8.18PWEE35 pKa = 4.42HH36 pKa = 6.79LYY38 pKa = 11.74VMVNAKK44 pKa = 10.3FEE46 pKa = 4.48EE47 pKa = 4.52EE48 pKa = 4.12TKK50 pKa = 10.07EE51 pKa = 4.02APVAEE56 pKa = 4.68GEE58 pKa = 4.41EE59 pKa = 4.46EE60 pKa = 4.74DD61 pKa = 6.13DD62 pKa = 5.21SDD64 pKa = 6.0DD65 pKa = 4.07DD66 pKa = 4.36SEE68 pKa = 5.15PIAEE72 pKa = 4.16FRR74 pKa = 11.84FVPSDD79 pKa = 3.36KK80 pKa = 10.88SALEE84 pKa = 3.78AMFAAMCEE92 pKa = 4.38CQALHH97 pKa = 7.41PDD99 pKa = 4.21PDD101 pKa = 5.77DD102 pKa = 4.05EE103 pKa = 7.61DD104 pKa = 4.46SDD106 pKa = 3.76NDD108 pKa = 3.97YY109 pKa = 11.37EE110 pKa = 4.59GEE112 pKa = 4.16EE113 pKa = 4.41YY114 pKa = 10.56DD115 pKa = 4.4VEE117 pKa = 4.26AHH119 pKa = 5.75EE120 pKa = 5.4LEE122 pKa = 5.33HH123 pKa = 8.4GDD125 pKa = 3.1IPSFYY130 pKa = 9.42TYY132 pKa = 11.03EE133 pKa = 4.17EE134 pKa = 4.58GLSHH138 pKa = 6.9LTAEE142 pKa = 4.71GQATLEE148 pKa = 4.11RR149 pKa = 11.84LEE151 pKa = 4.74GMLAQSVSSQYY162 pKa = 11.66NMAGVRR168 pKa = 11.84TEE170 pKa = 3.88DD171 pKa = 3.84SIRR174 pKa = 11.84EE175 pKa = 4.08YY176 pKa = 10.91EE177 pKa = 4.67DD178 pKa = 3.35GMEE181 pKa = 4.02VDD183 pKa = 3.84VAPVVAGQFEE193 pKa = 4.42DD194 pKa = 5.26AEE196 pKa = 4.32VDD198 pKa = 3.59HH199 pKa = 7.08
SS1 pKa = 7.12RR2 pKa = 11.84LTWLEE7 pKa = 3.51NSGVGFSLDD16 pKa = 3.46YY17 pKa = 9.24PTISLHH23 pKa = 6.08AVSRR27 pKa = 11.84DD28 pKa = 3.0LSAYY32 pKa = 8.18PWEE35 pKa = 4.42HH36 pKa = 6.79LYY38 pKa = 11.74VMVNAKK44 pKa = 10.3FEE46 pKa = 4.48EE47 pKa = 4.52EE48 pKa = 4.12TKK50 pKa = 10.07EE51 pKa = 4.02APVAEE56 pKa = 4.68GEE58 pKa = 4.41EE59 pKa = 4.46EE60 pKa = 4.74DD61 pKa = 6.13DD62 pKa = 5.21SDD64 pKa = 6.0DD65 pKa = 4.07DD66 pKa = 4.36SEE68 pKa = 5.15PIAEE72 pKa = 4.16FRR74 pKa = 11.84FVPSDD79 pKa = 3.36KK80 pKa = 10.88SALEE84 pKa = 3.78AMFAAMCEE92 pKa = 4.38CQALHH97 pKa = 7.41PDD99 pKa = 4.21PDD101 pKa = 5.77DD102 pKa = 4.05EE103 pKa = 7.61DD104 pKa = 4.46SDD106 pKa = 3.76NDD108 pKa = 3.97YY109 pKa = 11.37EE110 pKa = 4.59GEE112 pKa = 4.16EE113 pKa = 4.41YY114 pKa = 10.56DD115 pKa = 4.4VEE117 pKa = 4.26AHH119 pKa = 5.75EE120 pKa = 5.4LEE122 pKa = 5.33HH123 pKa = 8.4GDD125 pKa = 3.1IPSFYY130 pKa = 9.42TYY132 pKa = 11.03EE133 pKa = 4.17EE134 pKa = 4.58GLSHH138 pKa = 6.9LTAEE142 pKa = 4.71GQATLEE148 pKa = 4.11RR149 pKa = 11.84LEE151 pKa = 4.74GMLAQSVSSQYY162 pKa = 11.66NMAGVRR168 pKa = 11.84TEE170 pKa = 3.88DD171 pKa = 3.84SIRR174 pKa = 11.84EE175 pKa = 4.08YY176 pKa = 10.91EE177 pKa = 4.67DD178 pKa = 3.35GMEE181 pKa = 4.02VDD183 pKa = 3.84VAPVVAGQFEE193 pKa = 4.42DD194 pKa = 5.26AEE196 pKa = 4.32VDD198 pKa = 3.59HH199 pKa = 7.08
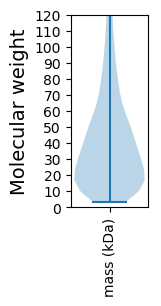
Molecular weight: 22.27 kDa
Isoelectric point according different methods:
Protein with the highest isoelectric point:
>tr|A0A091NKP0|A0A091NKP0_APAVI 6-phosphofructo-2-kinase/fructose-2 6-bisphosphatase 2 (Fragment) OS=Apaloderma vittatum OX=57397 GN=N311_11513 PE=4 SV=1
GG1 pKa = 7.26KK2 pKa = 10.29GRR4 pKa = 11.84EE5 pKa = 4.21GKK7 pKa = 10.25GRR9 pKa = 11.84AGKK12 pKa = 10.14GRR14 pKa = 11.84AGKK17 pKa = 10.12GRR19 pKa = 11.84AGKK22 pKa = 10.12GRR24 pKa = 11.84AGKK27 pKa = 10.12GRR29 pKa = 11.84AGKK32 pKa = 10.12GRR34 pKa = 11.84AGKK37 pKa = 10.12GRR39 pKa = 11.84AGKK42 pKa = 10.12GRR44 pKa = 11.84AGKK47 pKa = 10.12GRR49 pKa = 11.84AGKK52 pKa = 10.14GRR54 pKa = 11.84AGKK57 pKa = 10.28GG58 pKa = 3.09
GG1 pKa = 7.26KK2 pKa = 10.29GRR4 pKa = 11.84EE5 pKa = 4.21GKK7 pKa = 10.25GRR9 pKa = 11.84AGKK12 pKa = 10.14GRR14 pKa = 11.84AGKK17 pKa = 10.12GRR19 pKa = 11.84AGKK22 pKa = 10.12GRR24 pKa = 11.84AGKK27 pKa = 10.12GRR29 pKa = 11.84AGKK32 pKa = 10.12GRR34 pKa = 11.84AGKK37 pKa = 10.12GRR39 pKa = 11.84AGKK42 pKa = 10.12GRR44 pKa = 11.84AGKK47 pKa = 10.12GRR49 pKa = 11.84AGKK52 pKa = 10.14GRR54 pKa = 11.84AGKK57 pKa = 10.28GG58 pKa = 3.09
Molecular weight: 5.48 kDa
Isoelectric point according different methods:
Peptides (in silico digests for buttom-up proteomics)
Below you can find in silico digests of the whole proteome with Trypsin, Chymotrypsin, Trypsin+LysC, LysN, ArgC proteases suitable for different mass spec machines.| Try ESI |
 |
|---|
| ChTry ESI |
|
|---|
| ArgC ESI |
|
|---|
| LysN ESI |
|
|---|
| TryLysC ESI |
|
|---|
| Try MALDI |
|
|---|
| ChTry MALDI |
|
|---|
| ArgC MALDI |
|
|---|
| LysN MALDI |
|
|---|
| TryLysC MALDI |
|
|---|
| Try LTQ |
|
|---|
| ChTry LTQ |
|
|---|
| ArgC LTQ |
|
|---|
| LysN LTQ |
|
|---|
| TryLysC LTQ |
|
|---|
| Try MSlow |
|
|---|
| ChTry MSlow |
|
|---|
| ArgC MSlow |
|
|---|
| LysN MSlow |
|
|---|
| TryLysC MSlow |
|
|---|
| Try MShigh |
|
|---|
| ChTry MShigh |
|
|---|
| ArgC MShigh |
|
|---|
| LysN MShigh |
|
|---|
| TryLysC MShigh |
|
|---|
General Statistics
Number of major isoforms |
Number of additional isoforms |
Number of all proteins |
Number of amino acids |
Min. Seq. Length |
Max. Seq. Length |
Avg. Seq. Length |
Avg. Mol. Weight |
|---|---|---|---|---|---|---|---|
0 |
3310111 |
33 |
5821 |
418.8 |
47.09 |
Amino acid frequency
Ala |
Cys |
Asp |
Glu |
Phe |
Gly |
His |
Ile |
Lys |
Leu |
|---|---|---|---|---|---|---|---|---|---|
6.393 ± 0.021 | 2.233 ± 0.024 |
5.065 ± 0.021 | 7.216 ± 0.035 |
3.919 ± 0.02 | 5.829 ± 0.038 |
2.518 ± 0.014 | 5.023 ± 0.024 |
6.511 ± 0.034 | 9.696 ± 0.043 |
Met |
Asn |
Gln |
Pro |
Arg |
Ser |
Thr |
Val |
Trp |
Tyr |
|---|---|---|---|---|---|---|---|---|---|
2.236 ± 0.012 | 4.158 ± 0.017 |
5.215 ± 0.034 | 4.654 ± 0.03 |
5.191 ± 0.022 | 8.209 ± 0.04 |
5.394 ± 0.02 | 6.317 ± 0.024 |
1.196 ± 0.011 | 3.021 ± 0.018 |
Most of the basic statistics you can see at this page can be downloaded from this CSV file
See this proteome in:

Proteome-pI is available under Creative Commons Attribution-NoDerivs license, for more details see here
| Reference: Kozlowski LP. Proteome-pI 2.0: Proteome Isoelectric Point Database Update. Nucleic Acids Res. 2021, doi: 10.1093/nar/gkab944 | Contact: Lukasz P. Kozlowski |