Rubrobacter taiwanensis
Taxonomy: cellular organisms; Bacteria; Terrabacteria group; Actinobacteria; Rubrobacteria; Rubrobacterales; Rubrobacteraceae; Rubrobacter
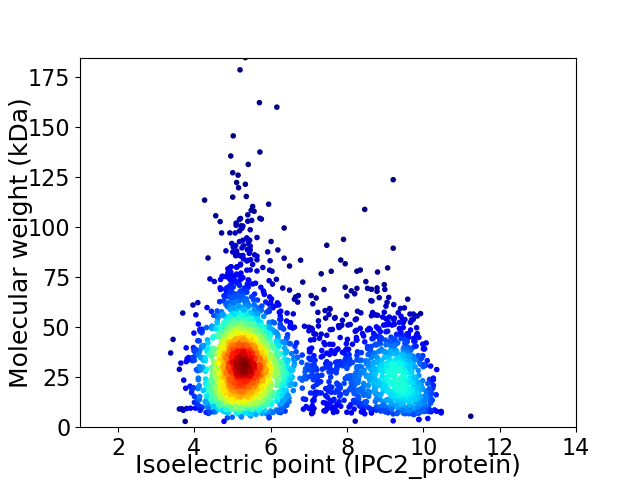
Average proteome isoelectric point is 6.35
Get precalculated fractions of proteins

Virtual 2D-PAGE plot for 3014 proteins (isoelectric point calculated using IPC2_protein)
Get csv file with sequences according to given criteria:
* You can choose from 21 different methods for calculating isoelectric point
Summary statistics related to proteome-wise predictions


Protein with the lowest isoelectric point:
>tr|A0A4R1BS95|A0A4R1BS95_9ACTN PA0069 family radical SAM protein OS=Rubrobacter taiwanensis OX=185139 GN=E0L93_00075 PE=4 SV=1
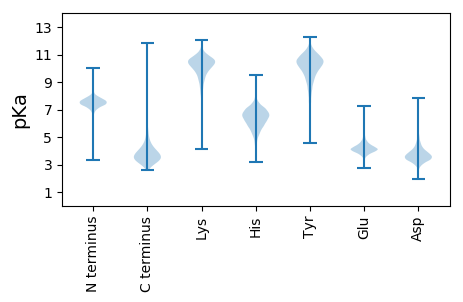
MM1 pKa = 7.33LRR3 pKa = 11.84VAHH6 pKa = 6.79LSPDD10 pKa = 3.38APNVDD15 pKa = 3.36VYY17 pKa = 11.8LNDD20 pKa = 3.41EE21 pKa = 4.56PVAEE25 pKa = 4.38LQGVPYY31 pKa = 9.08GTISPYY37 pKa = 10.97LPVPAGTQNVKK48 pKa = 10.25VYY50 pKa = 10.72AAGDD54 pKa = 3.39TSEE57 pKa = 4.44PVIEE61 pKa = 4.97ADD63 pKa = 3.09VDD65 pKa = 4.05LAAGADD71 pKa = 3.81YY72 pKa = 10.45TVGAVGLVEE81 pKa = 5.52DD82 pKa = 5.24GSLTAQVYY90 pKa = 10.3QDD92 pKa = 5.29DD93 pKa = 4.28NTPPAGDD100 pKa = 3.51NARR103 pKa = 11.84LRR105 pKa = 11.84VVHH108 pKa = 6.8ASPDD112 pKa = 3.5AGPVDD117 pKa = 4.05VGAQGGGNLVEE128 pKa = 4.93GLEE131 pKa = 4.36FPNASDD137 pKa = 3.84YY138 pKa = 12.02AEE140 pKa = 4.6VPAGTYY146 pKa = 9.24TIEE149 pKa = 4.03VKK151 pKa = 10.68AAGTDD156 pKa = 3.79QVALTVPDD164 pKa = 3.5VALNAGVVYY173 pKa = 10.67SAFAVGLAEE182 pKa = 5.85DD183 pKa = 4.53GSLDD187 pKa = 4.09VILTEE192 pKa = 5.92DD193 pKa = 3.7SMAMPDD199 pKa = 3.47TGGLSPGGVLLAGSLLFFSAAAAGILLLRR228 pKa = 11.84RR229 pKa = 11.84RR230 pKa = 11.84LTT232 pKa = 3.4
MM1 pKa = 7.33LRR3 pKa = 11.84VAHH6 pKa = 6.79LSPDD10 pKa = 3.38APNVDD15 pKa = 3.36VYY17 pKa = 11.8LNDD20 pKa = 3.41EE21 pKa = 4.56PVAEE25 pKa = 4.38LQGVPYY31 pKa = 9.08GTISPYY37 pKa = 10.97LPVPAGTQNVKK48 pKa = 10.25VYY50 pKa = 10.72AAGDD54 pKa = 3.39TSEE57 pKa = 4.44PVIEE61 pKa = 4.97ADD63 pKa = 3.09VDD65 pKa = 4.05LAAGADD71 pKa = 3.81YY72 pKa = 10.45TVGAVGLVEE81 pKa = 5.52DD82 pKa = 5.24GSLTAQVYY90 pKa = 10.3QDD92 pKa = 5.29DD93 pKa = 4.28NTPPAGDD100 pKa = 3.51NARR103 pKa = 11.84LRR105 pKa = 11.84VVHH108 pKa = 6.8ASPDD112 pKa = 3.5AGPVDD117 pKa = 4.05VGAQGGGNLVEE128 pKa = 4.93GLEE131 pKa = 4.36FPNASDD137 pKa = 3.84YY138 pKa = 12.02AEE140 pKa = 4.6VPAGTYY146 pKa = 9.24TIEE149 pKa = 4.03VKK151 pKa = 10.68AAGTDD156 pKa = 3.79QVALTVPDD164 pKa = 3.5VALNAGVVYY173 pKa = 10.67SAFAVGLAEE182 pKa = 5.85DD183 pKa = 4.53GSLDD187 pKa = 4.09VILTEE192 pKa = 5.92DD193 pKa = 3.7SMAMPDD199 pKa = 3.47TGGLSPGGVLLAGSLLFFSAAAAGILLLRR228 pKa = 11.84RR229 pKa = 11.84RR230 pKa = 11.84LTT232 pKa = 3.4
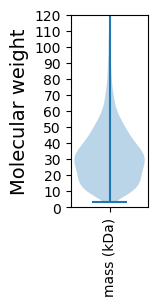
Molecular weight: 23.52 kDa
Isoelectric point according different methods:
Protein with the highest isoelectric point:
>tr|A0A4R1BFP3|A0A4R1BFP3_9ACTN Shikimate dehydrogenase OS=Rubrobacter taiwanensis OX=185139 GN=E0L93_11830 PE=4 SV=1
MM1 pKa = 7.35KK2 pKa = 9.4RR3 pKa = 11.84TYY5 pKa = 10.21QPNRR9 pKa = 11.84RR10 pKa = 11.84KK11 pKa = 9.57RR12 pKa = 11.84HH13 pKa = 4.5KK14 pKa = 7.95THH16 pKa = 6.0GFRR19 pKa = 11.84RR20 pKa = 11.84RR21 pKa = 11.84RR22 pKa = 11.84RR23 pKa = 11.84TTAGRR28 pKa = 11.84KK29 pKa = 8.66ILAARR34 pKa = 11.84RR35 pKa = 11.84RR36 pKa = 11.84KK37 pKa = 9.04GRR39 pKa = 11.84KK40 pKa = 8.79RR41 pKa = 11.84LAVV44 pKa = 3.41
MM1 pKa = 7.35KK2 pKa = 9.4RR3 pKa = 11.84TYY5 pKa = 10.21QPNRR9 pKa = 11.84RR10 pKa = 11.84KK11 pKa = 9.57RR12 pKa = 11.84HH13 pKa = 4.5KK14 pKa = 7.95THH16 pKa = 6.0GFRR19 pKa = 11.84RR20 pKa = 11.84RR21 pKa = 11.84RR22 pKa = 11.84RR23 pKa = 11.84TTAGRR28 pKa = 11.84KK29 pKa = 8.66ILAARR34 pKa = 11.84RR35 pKa = 11.84RR36 pKa = 11.84KK37 pKa = 9.04GRR39 pKa = 11.84KK40 pKa = 8.79RR41 pKa = 11.84LAVV44 pKa = 3.41
Molecular weight: 5.48 kDa
Isoelectric point according different methods:
Peptides (in silico digests for buttom-up proteomics)
Below you can find in silico digests of the whole proteome with Trypsin, Chymotrypsin, Trypsin+LysC, LysN, ArgC proteases suitable for different mass spec machines.| Try ESI |
 |
|---|
| ChTry ESI |
 |
|---|
| ArgC ESI |
 |
|---|
| LysN ESI |
 |
|---|
| TryLysC ESI |
 |
|---|
| Try MALDI |
 |
|---|
| ChTry MALDI |
 |
|---|
| ArgC MALDI |
 |
|---|
| LysN MALDI |
 |
|---|
| TryLysC MALDI |
 |
|---|
| Try LTQ |
 |
|---|
| ChTry LTQ |
 |
|---|
| ArgC LTQ |
 |
|---|
| LysN LTQ |
 |
|---|
| TryLysC LTQ |
 |
|---|
| Try MSlow |
 |
|---|
| ChTry MSlow |
 |
|---|
| ArgC MSlow |
 |
|---|
| LysN MSlow |
 |
|---|
| TryLysC MSlow |
 |
|---|
| Try MShigh |
 |
|---|
| ChTry MShigh |
 |
|---|
| ArgC MShigh |
 |
|---|
| LysN MShigh |
 |
|---|
| TryLysC MShigh |
 |
|---|
General Statistics
Number of major isoforms |
Number of additional isoforms |
Number of all proteins |
Number of amino acids |
Min. Seq. Length |
Max. Seq. Length |
Avg. Seq. Length |
Avg. Mol. Weight |
|---|---|---|---|---|---|---|---|
0 |
923775 |
28 |
1613 |
306.5 |
33.53 |
Amino acid frequency
Ala |
Cys |
Asp |
Glu |
Phe |
Gly |
His |
Ile |
Lys |
Leu |
|---|---|---|---|---|---|---|---|---|---|
11.305 ± 0.055 | 0.754 ± 0.013 |
4.597 ± 0.034 | 8.446 ± 0.061 |
3.518 ± 0.029 | 9.559 ± 0.045 |
1.802 ± 0.018 | 4.496 ± 0.038 |
2.268 ± 0.027 | 10.765 ± 0.055 |
Met |
Asn |
Gln |
Pro |
Arg |
Ser |
Thr |
Val |
Trp |
Tyr |
|---|---|---|---|---|---|---|---|---|---|
2.04 ± 0.017 | 2.073 ± 0.019 |
5.366 ± 0.03 | 2.307 ± 0.028 |
8.988 ± 0.055 | 5.021 ± 0.026 |
4.421 ± 0.028 | 8.369 ± 0.041 |
1.228 ± 0.021 | 2.676 ± 0.024 |
Most of the basic statistics you can see at this page can be downloaded from this CSV file
Proteome-pI is available under Creative Commons Attribution-NoDerivs license, for more details see here
| Reference: Kozlowski LP. Proteome-pI 2.0: Proteome Isoelectric Point Database Update. Nucleic Acids Res. 2021, doi: 10.1093/nar/gkab944 | Contact: Lukasz P. Kozlowski |
