Paenibacillus psychroresistens
Taxonomy: cellular organisms; Bacteria; Terrabacteria group; Firmicutes; Bacilli; Bacillales; Paenibacillaceae; Paenibacillus
Average proteome isoelectric point is 6.28
Get precalculated fractions of proteins

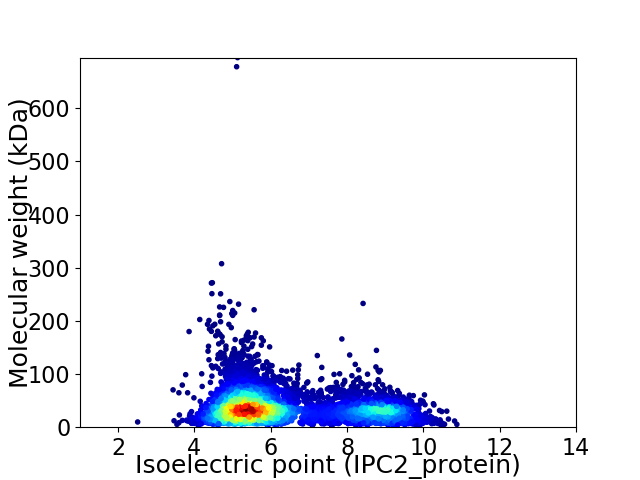
Virtual 2D-PAGE plot for 6938 proteins (isoelectric point calculated using IPC2_protein)
Get csv file with sequences according to given criteria:
* You can choose from 21 different methods for calculating isoelectric point
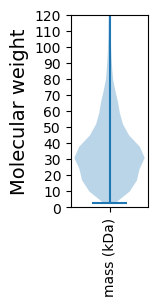
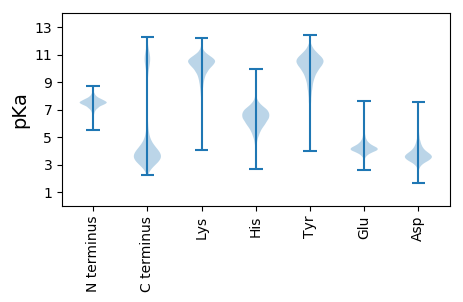
Summary statistics related to proteome-wise predictions


Protein with the lowest isoelectric point:
>tr|A0A6B8RJZ1|A0A6B8RJZ1_9BACL Ferredoxin--NADP reductase OS=Paenibacillus psychroresistens OX=1778678 GN=EHS13_14015 PE=3 SV=1
MM1 pKa = 7.79SIQNLIVNGGFEE13 pKa = 4.6TGTLAPWIPANTTITSLFSHH33 pKa = 6.68SGTFSARR40 pKa = 11.84LQGGPVTSYY49 pKa = 9.85IGQFVPVTQGDD60 pKa = 3.83SFEE63 pKa = 4.5ILISLAKK70 pKa = 10.64VGFLPAAPVIIQVFYY85 pKa = 10.71FDD87 pKa = 5.91SIFNLLGQGLFTNVPIDD104 pKa = 5.04RR105 pKa = 11.84IPTADD110 pKa = 2.99NHH112 pKa = 5.42TWLEE116 pKa = 4.25IYY118 pKa = 8.26QTTTPAPLGSTQAFVLIDD136 pKa = 3.86NLPQAGTADD145 pKa = 3.39ILVDD149 pKa = 4.8DD150 pKa = 4.7VALLAAGGSGSTGPTGATGATGDD173 pKa = 3.71TGAMGVTGATGAMGVAGVTGAMGVTGVTGAMGVTGVTGVTGATGDD218 pKa = 3.7TGVTGATGDD227 pKa = 3.7TGVTGATGDD236 pKa = 3.7TGVTGATGDD245 pKa = 3.7TGVTGATGDD254 pKa = 3.7TGVTGATGDD263 pKa = 3.58TGATGATGATGDD275 pKa = 3.96TGAMGATGVTGVTGATGDD293 pKa = 3.58TGATGATGTTGATGVTGSTGATGDD317 pKa = 3.39TGATGTTGVTGATGAMGVTGATGTTGATGDD347 pKa = 3.54TGATGTTGTTGTTGVTGATGTTGVTGATGAMGVTGATGTTGATGVTGATGDD398 pKa = 3.48TGATGVTGTTGVTGTTGVTGVTGVTGVTGATGATGATGATGTTGATGATGATGATGVTGATGATGATGAMGVTGVTGTTGATGDD482 pKa = 3.73TGATGATGATGVTGATGDD500 pKa = 3.58TGATGATGATGVTGATGATGVTGATGATGATGATGATGATGATGATGATGAIGDD554 pKa = 4.16TGVTGATGATGAVSSAYY571 pKa = 10.11AYY573 pKa = 10.35VFNLGVQGVGANVDD587 pKa = 3.87VIFSNNGPLVGGISHH602 pKa = 7.61IAGTAPVTILVAGNYY617 pKa = 8.76HH618 pKa = 5.85IQWSITVNQNIQTAYY633 pKa = 10.62AIVLNGATLPQTLFGFGVNSSANSFFQTAGHH664 pKa = 6.5SIITVPASATITLRR678 pKa = 11.84NVGFADD684 pKa = 3.75NLATSLDD691 pKa = 3.51GQQIVNASLEE701 pKa = 4.41IIKK704 pKa = 9.02LTLL707 pKa = 3.39
MM1 pKa = 7.79SIQNLIVNGGFEE13 pKa = 4.6TGTLAPWIPANTTITSLFSHH33 pKa = 6.68SGTFSARR40 pKa = 11.84LQGGPVTSYY49 pKa = 9.85IGQFVPVTQGDD60 pKa = 3.83SFEE63 pKa = 4.5ILISLAKK70 pKa = 10.64VGFLPAAPVIIQVFYY85 pKa = 10.71FDD87 pKa = 5.91SIFNLLGQGLFTNVPIDD104 pKa = 5.04RR105 pKa = 11.84IPTADD110 pKa = 2.99NHH112 pKa = 5.42TWLEE116 pKa = 4.25IYY118 pKa = 8.26QTTTPAPLGSTQAFVLIDD136 pKa = 3.86NLPQAGTADD145 pKa = 3.39ILVDD149 pKa = 4.8DD150 pKa = 4.7VALLAAGGSGSTGPTGATGATGDD173 pKa = 3.71TGAMGVTGATGAMGVAGVTGAMGVTGVTGAMGVTGVTGVTGATGDD218 pKa = 3.7TGVTGATGDD227 pKa = 3.7TGVTGATGDD236 pKa = 3.7TGVTGATGDD245 pKa = 3.7TGVTGATGDD254 pKa = 3.7TGVTGATGDD263 pKa = 3.58TGATGATGATGDD275 pKa = 3.96TGAMGATGVTGVTGATGDD293 pKa = 3.58TGATGATGTTGATGVTGSTGATGDD317 pKa = 3.39TGATGTTGVTGATGAMGVTGATGTTGATGDD347 pKa = 3.54TGATGTTGTTGTTGVTGATGTTGVTGATGAMGVTGATGTTGATGVTGATGDD398 pKa = 3.48TGATGVTGTTGVTGTTGVTGVTGVTGVTGATGATGATGATGTTGATGATGATGATGVTGATGATGATGAMGVTGVTGTTGATGDD482 pKa = 3.73TGATGATGATGVTGATGDD500 pKa = 3.58TGATGATGATGVTGATGATGVTGATGATGATGATGATGATGATGATGATGAIGDD554 pKa = 4.16TGVTGATGATGAVSSAYY571 pKa = 10.11AYY573 pKa = 10.35VFNLGVQGVGANVDD587 pKa = 3.87VIFSNNGPLVGGISHH602 pKa = 7.61IAGTAPVTILVAGNYY617 pKa = 8.76HH618 pKa = 5.85IQWSITVNQNIQTAYY633 pKa = 10.62AIVLNGATLPQTLFGFGVNSSANSFFQTAGHH664 pKa = 6.5SIITVPASATITLRR678 pKa = 11.84NVGFADD684 pKa = 3.75NLATSLDD691 pKa = 3.51GQQIVNASLEE701 pKa = 4.41IIKK704 pKa = 9.02LTLL707 pKa = 3.39
Molecular weight: 64.73 kDa
Isoelectric point according different methods:
Protein with the highest isoelectric point:
>tr|A0A6B8RUQ9|A0A6B8RUQ9_9BACL N-acetyltransferase OS=Paenibacillus psychroresistens OX=1778678 GN=EHS13_33140 PE=4 SV=1
MM1 pKa = 7.67EE2 pKa = 4.37PTFRR6 pKa = 11.84PNVRR10 pKa = 11.84KK11 pKa = 9.86RR12 pKa = 11.84KK13 pKa = 8.61KK14 pKa = 8.79NHH16 pKa = 4.94GFRR19 pKa = 11.84TRR21 pKa = 11.84MSTKK25 pKa = 9.13NGRR28 pKa = 11.84RR29 pKa = 11.84VIQARR34 pKa = 11.84RR35 pKa = 11.84LKK37 pKa = 10.52GRR39 pKa = 11.84KK40 pKa = 9.07KK41 pKa = 9.61LTAA44 pKa = 4.2
MM1 pKa = 7.67EE2 pKa = 4.37PTFRR6 pKa = 11.84PNVRR10 pKa = 11.84KK11 pKa = 9.86RR12 pKa = 11.84KK13 pKa = 8.61KK14 pKa = 8.79NHH16 pKa = 4.94GFRR19 pKa = 11.84TRR21 pKa = 11.84MSTKK25 pKa = 9.13NGRR28 pKa = 11.84RR29 pKa = 11.84VIQARR34 pKa = 11.84RR35 pKa = 11.84LKK37 pKa = 10.52GRR39 pKa = 11.84KK40 pKa = 9.07KK41 pKa = 9.61LTAA44 pKa = 4.2
Molecular weight: 5.31 kDa
Isoelectric point according different methods:
Peptides (in silico digests for buttom-up proteomics)
Below you can find in silico digests of the whole proteome with Trypsin, Chymotrypsin, Trypsin+LysC, LysN, ArgC proteases suitable for different mass spec machines.| Try ESI |
 |
|---|
| ChTry ESI |
 |
|---|
| ArgC ESI |
 |
|---|
| LysN ESI |
 |
|---|
| TryLysC ESI |
 |
|---|
| Try MALDI |
 |
|---|
| ChTry MALDI |
 |
|---|
| ArgC MALDI |
 |
|---|
| LysN MALDI |
 |
|---|
| TryLysC MALDI |
 |
|---|
| Try LTQ |
 |
|---|
| ChTry LTQ |
 |
|---|
| ArgC LTQ |
 |
|---|
| LysN LTQ |
 |
|---|
| TryLysC LTQ |
 |
|---|
| Try MSlow |
 |
|---|
| ChTry MSlow |
 |
|---|
| ArgC MSlow |
 |
|---|
| LysN MSlow |
 |
|---|
| TryLysC MSlow |
 |
|---|
| Try MShigh |
 |
|---|
| ChTry MShigh |
 |
|---|
| ArgC MShigh |
 |
|---|
| LysN MShigh |
 |
|---|
| TryLysC MShigh |
 |
|---|
General Statistics
Number of major isoforms |
Number of additional isoforms |
Number of all proteins |
Number of amino acids |
Min. Seq. Length |
Max. Seq. Length |
Avg. Seq. Length |
Avg. Mol. Weight |
|---|---|---|---|---|---|---|---|
0 |
2366348 |
25 |
6114 |
341.1 |
38.16 |
Amino acid frequency
Ala |
Cys |
Asp |
Glu |
Phe |
Gly |
His |
Ile |
Lys |
Leu |
|---|---|---|---|---|---|---|---|---|---|
7.501 ± 0.036 | 0.738 ± 0.009 |
5.109 ± 0.022 | 6.248 ± 0.037 |
4.471 ± 0.023 | 6.767 ± 0.038 |
2.041 ± 0.015 | 7.82 ± 0.032 |
5.988 ± 0.03 | 10.069 ± 0.042 |
Met |
Asn |
Gln |
Pro |
Arg |
Ser |
Thr |
Val |
Trp |
Tyr |
|---|---|---|---|---|---|---|---|---|---|
2.675 ± 0.016 | 4.674 ± 0.03 |
3.809 ± 0.018 | 3.976 ± 0.022 |
3.975 ± 0.024 | 6.668 ± 0.027 |
5.817 ± 0.046 | 6.611 ± 0.024 |
1.334 ± 0.012 | 3.709 ± 0.022 |
Most of the basic statistics you can see at this page can be downloaded from this CSV file
Proteome-pI is available under Creative Commons Attribution-NoDerivs license, for more details see here
| Reference: Kozlowski LP. Proteome-pI 2.0: Proteome Isoelectric Point Database Update. Nucleic Acids Res. 2021, doi: 10.1093/nar/gkab944 | Contact: Lukasz P. Kozlowski |
