Salmonella phage SAP012
Taxonomy: Viruses; Duplodnaviria; Heunggongvirae; Uroviricota; Caudoviricetes; Caudovirales; Siphoviridae; unclassified Siphoviridae
Average proteome isoelectric point is 6.16
Get precalculated fractions of proteins

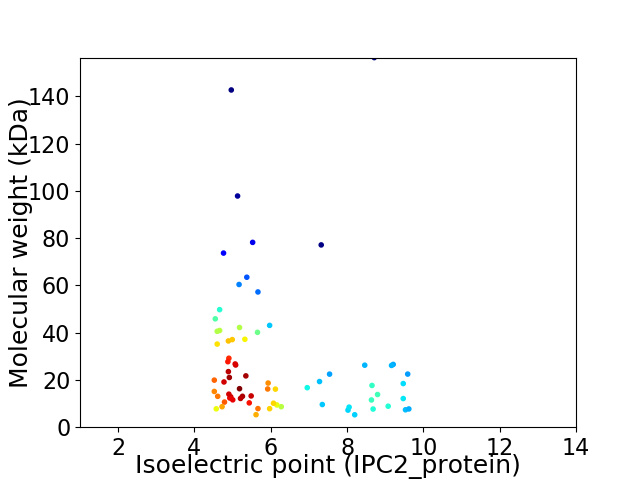
Virtual 2D-PAGE plot for 72 proteins (isoelectric point calculated using IPC2_protein)
Get csv file with sequences according to given criteria:
* You can choose from 21 different methods for calculating isoelectric point
Summary statistics related to proteome-wise predictions


Protein with the lowest isoelectric point:
>tr|A0A6J4EFD2|A0A6J4EFD2_9CAUD Uncharacterized protein OS=Salmonella phage SAP012 OX=2742114 PE=4 SV=1
MM1 pKa = 7.21LTIKK5 pKa = 10.39DD6 pKa = 3.91LHH8 pKa = 6.24NAWKK12 pKa = 10.48SNTAAVIDD20 pKa = 4.3NPADD24 pKa = 2.81SWGRR28 pKa = 11.84YY29 pKa = 6.89TEE31 pKa = 4.18IACYY35 pKa = 9.56EE36 pKa = 4.14YY37 pKa = 11.62NDD39 pKa = 3.53ITKK42 pKa = 9.81LQYY45 pKa = 10.05HH46 pKa = 6.9HH47 pKa = 7.24CPDD50 pKa = 3.64YY51 pKa = 11.62NDD53 pKa = 3.72IEE55 pKa = 4.23EE56 pKa = 4.48KK57 pKa = 10.88GFNEE61 pKa = 4.16NMSNEE66 pKa = 3.88IAVLLGLMGVTFEE79 pKa = 5.08CIRR82 pKa = 11.84DD83 pKa = 3.12IDD85 pKa = 3.63RR86 pKa = 11.84RR87 pKa = 11.84MTTVIFRR94 pKa = 11.84RR95 pKa = 11.84GGVFYY100 pKa = 10.78AHH102 pKa = 7.74DD103 pKa = 4.77YY104 pKa = 10.79INVVNDD110 pKa = 3.08ISISDD115 pKa = 3.98ALGDD119 pKa = 3.64ALSRR123 pKa = 11.84CEE125 pKa = 4.13SFVVGDD131 pKa = 4.45PKK133 pKa = 10.94RR134 pKa = 11.84EE135 pKa = 4.08DD136 pKa = 3.6YY137 pKa = 9.17EE138 pKa = 4.12TEE140 pKa = 3.97YY141 pKa = 10.95QFKK144 pKa = 10.65KK145 pKa = 10.38EE146 pKa = 3.75YY147 pKa = 10.3RR148 pKa = 11.84EE149 pKa = 3.89YY150 pKa = 10.56CLLYY154 pKa = 10.71AVFTPGEE161 pKa = 4.15MLDD164 pKa = 4.43LLALVQSEE172 pKa = 4.2
MM1 pKa = 7.21LTIKK5 pKa = 10.39DD6 pKa = 3.91LHH8 pKa = 6.24NAWKK12 pKa = 10.48SNTAAVIDD20 pKa = 4.3NPADD24 pKa = 2.81SWGRR28 pKa = 11.84YY29 pKa = 6.89TEE31 pKa = 4.18IACYY35 pKa = 9.56EE36 pKa = 4.14YY37 pKa = 11.62NDD39 pKa = 3.53ITKK42 pKa = 9.81LQYY45 pKa = 10.05HH46 pKa = 6.9HH47 pKa = 7.24CPDD50 pKa = 3.64YY51 pKa = 11.62NDD53 pKa = 3.72IEE55 pKa = 4.23EE56 pKa = 4.48KK57 pKa = 10.88GFNEE61 pKa = 4.16NMSNEE66 pKa = 3.88IAVLLGLMGVTFEE79 pKa = 5.08CIRR82 pKa = 11.84DD83 pKa = 3.12IDD85 pKa = 3.63RR86 pKa = 11.84RR87 pKa = 11.84MTTVIFRR94 pKa = 11.84RR95 pKa = 11.84GGVFYY100 pKa = 10.78AHH102 pKa = 7.74DD103 pKa = 4.77YY104 pKa = 10.79INVVNDD110 pKa = 3.08ISISDD115 pKa = 3.98ALGDD119 pKa = 3.64ALSRR123 pKa = 11.84CEE125 pKa = 4.13SFVVGDD131 pKa = 4.45PKK133 pKa = 10.94RR134 pKa = 11.84EE135 pKa = 4.08DD136 pKa = 3.6YY137 pKa = 9.17EE138 pKa = 4.12TEE140 pKa = 3.97YY141 pKa = 10.95QFKK144 pKa = 10.65KK145 pKa = 10.38EE146 pKa = 3.75YY147 pKa = 10.3RR148 pKa = 11.84EE149 pKa = 3.89YY150 pKa = 10.56CLLYY154 pKa = 10.71AVFTPGEE161 pKa = 4.15MLDD164 pKa = 4.43LLALVQSEE172 pKa = 4.2
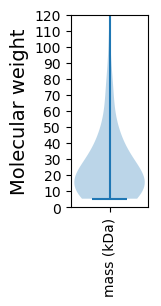
Molecular weight: 19.91 kDa
Isoelectric point according different methods:
Protein with the highest isoelectric point:
>tr|A0A6J4EGZ9|A0A6J4EGZ9_9CAUD Uncharacterized protein OS=Salmonella phage SAP012 OX=2742114 PE=4 SV=1
MM1 pKa = 7.4ASKK4 pKa = 10.44RR5 pKa = 11.84RR6 pKa = 11.84IRR8 pKa = 11.84FKK10 pKa = 10.59EE11 pKa = 3.91CGRR14 pKa = 11.84KK15 pKa = 8.39QRR17 pKa = 11.84FPDD20 pKa = 3.38KK21 pKa = 10.07EE22 pKa = 4.01AASTAIQTLHH32 pKa = 6.76RR33 pKa = 11.84RR34 pKa = 11.84LGYY37 pKa = 10.18QGFICPYY44 pKa = 7.79PCRR47 pKa = 11.84WCNGWHH53 pKa = 6.31FGHH56 pKa = 6.95VKK58 pKa = 10.6GQDD61 pKa = 3.35TRR63 pKa = 11.84NKK65 pKa = 10.21
MM1 pKa = 7.4ASKK4 pKa = 10.44RR5 pKa = 11.84RR6 pKa = 11.84IRR8 pKa = 11.84FKK10 pKa = 10.59EE11 pKa = 3.91CGRR14 pKa = 11.84KK15 pKa = 8.39QRR17 pKa = 11.84FPDD20 pKa = 3.38KK21 pKa = 10.07EE22 pKa = 4.01AASTAIQTLHH32 pKa = 6.76RR33 pKa = 11.84RR34 pKa = 11.84LGYY37 pKa = 10.18QGFICPYY44 pKa = 7.79PCRR47 pKa = 11.84WCNGWHH53 pKa = 6.31FGHH56 pKa = 6.95VKK58 pKa = 10.6GQDD61 pKa = 3.35TRR63 pKa = 11.84NKK65 pKa = 10.21
Molecular weight: 7.72 kDa
Isoelectric point according different methods:
Peptides (in silico digests for buttom-up proteomics)
Below you can find in silico digests of the whole proteome with Trypsin, Chymotrypsin, Trypsin+LysC, LysN, ArgC proteases suitable for different mass spec machines.| Try ESI |
 |
|---|
| ChTry ESI |
 |
|---|
| ArgC ESI |
 |
|---|
| LysN ESI |
 |
|---|
| TryLysC ESI |
 |
|---|
| Try MALDI |
 |
|---|
| ChTry MALDI |
 |
|---|
| ArgC MALDI |
 |
|---|
| LysN MALDI |
 |
|---|
| TryLysC MALDI |
 |
|---|
| Try LTQ |
 |
|---|
| ChTry LTQ |
 |
|---|
| ArgC LTQ |
 |
|---|
| LysN LTQ |
 |
|---|
| TryLysC LTQ |
 |
|---|
| Try MSlow |
 |
|---|
| ChTry MSlow |
 |
|---|
| ArgC MSlow |
 |
|---|
| LysN MSlow |
 |
|---|
| TryLysC MSlow |
 |
|---|
| Try MShigh |
 |
|---|
| ChTry MShigh |
 |
|---|
| ArgC MShigh |
 |
|---|
| LysN MShigh |
 |
|---|
| TryLysC MShigh |
 |
|---|
General Statistics
Number of major isoforms |
Number of additional isoforms |
Number of all proteins |
Number of amino acids |
Min. Seq. Length |
Max. Seq. Length |
Avg. Seq. Length |
Avg. Mol. Weight |
|---|---|---|---|---|---|---|---|
0 |
18347 |
47 |
1454 |
254.8 |
28.3 |
Amino acid frequency
Ala |
Cys |
Asp |
Glu |
Phe |
Gly |
His |
Ile |
Lys |
Leu |
|---|---|---|---|---|---|---|---|---|---|
9.582 ± 0.569 | 0.981 ± 0.126 |
6.628 ± 0.238 | 6.17 ± 0.255 |
3.407 ± 0.157 | 7.364 ± 0.244 |
1.755 ± 0.135 | 5.559 ± 0.162 |
5.521 ± 0.294 | 7.304 ± 0.242 |
Met |
Asn |
Gln |
Pro |
Arg |
Ser |
Thr |
Val |
Trp |
Tyr |
|---|---|---|---|---|---|---|---|---|---|
3.178 ± 0.13 | 4.404 ± 0.19 |
4.578 ± 0.354 | 3.652 ± 0.298 |
5.663 ± 0.206 | 5.701 ± 0.273 |
6.192 ± 0.301 | 7.233 ± 0.365 |
1.728 ± 0.146 | 3.401 ± 0.179 |
Most of the basic statistics you can see at this page can be downloaded from this CSV file
Proteome-pI is available under Creative Commons Attribution-NoDerivs license, for more details see here
| Reference: Kozlowski LP. Proteome-pI 2.0: Proteome Isoelectric Point Database Update. Nucleic Acids Res. 2021, doi: 10.1093/nar/gkab944 | Contact: Lukasz P. Kozlowski |
