Sinomicrobium oceani
Taxonomy: cellular organisms; Bacteria; FCB group; Bacteroidetes/Chlorobi group; Bacteroidetes; Flavobacteriia; Flavobacteriales; Flavobacteriaceae; Sinomicrobium
Average proteome isoelectric point is 6.47
Get precalculated fractions of proteins

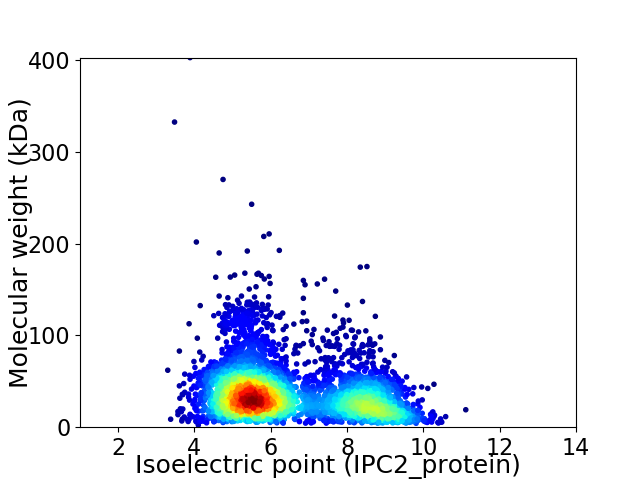
Virtual 2D-PAGE plot for 4212 proteins (isoelectric point calculated using IPC2_protein)
Get csv file with sequences according to given criteria:
* You can choose from 21 different methods for calculating isoelectric point
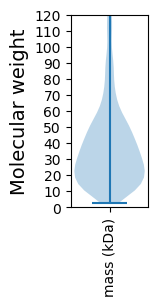
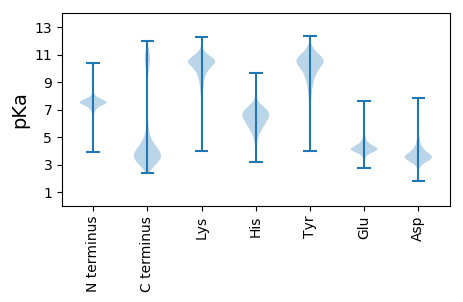
Summary statistics related to proteome-wise predictions


Protein with the lowest isoelectric point:
>tr|A0A1K1QBR9|A0A1K1QBR9_9FLAO Alpha-L-fucosidase OS=Sinomicrobium oceani OX=1150368 GN=SAMN02927921_02443 PE=4 SV=1
MM1 pKa = 7.45KK2 pKa = 10.37KK3 pKa = 9.66ILALVLVSALVFVSCEE19 pKa = 3.93GDD21 pKa = 3.18QGPPGQDD28 pKa = 3.1GLDD31 pKa = 3.67GLNGHH36 pKa = 6.57IFEE39 pKa = 5.59AGPVDD44 pKa = 4.99LSYY47 pKa = 11.61DD48 pKa = 3.65PATNLYY54 pKa = 10.23SAIINFADD62 pKa = 3.55EE63 pKa = 4.29TDD65 pKa = 4.37FEE67 pKa = 4.64ILDD70 pKa = 3.63TDD72 pKa = 3.52AVLVYY77 pKa = 10.08RR78 pKa = 11.84LQGSVEE84 pKa = 4.27FNDD87 pKa = 3.74GTTADD92 pKa = 3.59SWALLPLTYY101 pKa = 10.33TPDD104 pKa = 3.2EE105 pKa = 4.05GTFYY109 pKa = 10.83YY110 pKa = 10.28TFEE113 pKa = 4.37HH114 pKa = 6.78NYY116 pKa = 9.17IDD118 pKa = 3.58TEE120 pKa = 4.06IFIDD124 pKa = 4.52GNFDD128 pKa = 3.63LSGLASEE135 pKa = 4.57YY136 pKa = 10.18TQDD139 pKa = 3.19QIFRR143 pKa = 11.84IVIIPNPDD151 pKa = 3.12AQGLNVSNFDD161 pKa = 3.77EE162 pKa = 4.34VLKK165 pKa = 10.9ALNPEE170 pKa = 4.02QIKK173 pKa = 10.56QIEE176 pKa = 4.37IKK178 pKa = 10.72NN179 pKa = 3.68
MM1 pKa = 7.45KK2 pKa = 10.37KK3 pKa = 9.66ILALVLVSALVFVSCEE19 pKa = 3.93GDD21 pKa = 3.18QGPPGQDD28 pKa = 3.1GLDD31 pKa = 3.67GLNGHH36 pKa = 6.57IFEE39 pKa = 5.59AGPVDD44 pKa = 4.99LSYY47 pKa = 11.61DD48 pKa = 3.65PATNLYY54 pKa = 10.23SAIINFADD62 pKa = 3.55EE63 pKa = 4.29TDD65 pKa = 4.37FEE67 pKa = 4.64ILDD70 pKa = 3.63TDD72 pKa = 3.52AVLVYY77 pKa = 10.08RR78 pKa = 11.84LQGSVEE84 pKa = 4.27FNDD87 pKa = 3.74GTTADD92 pKa = 3.59SWALLPLTYY101 pKa = 10.33TPDD104 pKa = 3.2EE105 pKa = 4.05GTFYY109 pKa = 10.83YY110 pKa = 10.28TFEE113 pKa = 4.37HH114 pKa = 6.78NYY116 pKa = 9.17IDD118 pKa = 3.58TEE120 pKa = 4.06IFIDD124 pKa = 4.52GNFDD128 pKa = 3.63LSGLASEE135 pKa = 4.57YY136 pKa = 10.18TQDD139 pKa = 3.19QIFRR143 pKa = 11.84IVIIPNPDD151 pKa = 3.12AQGLNVSNFDD161 pKa = 3.77EE162 pKa = 4.34VLKK165 pKa = 10.9ALNPEE170 pKa = 4.02QIKK173 pKa = 10.56QIEE176 pKa = 4.37IKK178 pKa = 10.72NN179 pKa = 3.68
Molecular weight: 19.79 kDa
Isoelectric point according different methods:
Protein with the highest isoelectric point:
>tr|A0A1K1QG68|A0A1K1QG68_9FLAO Phosphate-selective porin O and P OS=Sinomicrobium oceani OX=1150368 GN=SAMN02927921_02506 PE=4 SV=1
MM1 pKa = 7.0LTADD5 pKa = 3.87RR6 pKa = 11.84VMLTADD12 pKa = 3.71RR13 pKa = 11.84LMLTANRR20 pKa = 11.84TGLTAKK26 pKa = 10.18RR27 pKa = 11.84VMSTANRR34 pKa = 11.84VVLTAKK40 pKa = 10.4RR41 pKa = 11.84VGLTANRR48 pKa = 11.84IGLTANRR55 pKa = 11.84VVLTANRR62 pKa = 11.84AMLPANRR69 pKa = 11.84VMPTAKK75 pKa = 10.05RR76 pKa = 11.84VGLTANRR83 pKa = 11.84IVLTANRR90 pKa = 11.84VVLTANRR97 pKa = 11.84VVLTANRR104 pKa = 11.84VVLTANRR111 pKa = 11.84VVLTANRR118 pKa = 11.84VGLTANRR125 pKa = 11.84VVLTANRR132 pKa = 11.84IGLTANRR139 pKa = 11.84VVLTANRR146 pKa = 11.84VRR148 pKa = 11.84LTVNRR153 pKa = 11.84IGLTANRR160 pKa = 11.84IRR162 pKa = 11.84LTANRR167 pKa = 11.84TGLVVNTIPP176 pKa = 4.74
MM1 pKa = 7.0LTADD5 pKa = 3.87RR6 pKa = 11.84VMLTADD12 pKa = 3.71RR13 pKa = 11.84LMLTANRR20 pKa = 11.84TGLTAKK26 pKa = 10.18RR27 pKa = 11.84VMSTANRR34 pKa = 11.84VVLTAKK40 pKa = 10.4RR41 pKa = 11.84VGLTANRR48 pKa = 11.84IGLTANRR55 pKa = 11.84VVLTANRR62 pKa = 11.84AMLPANRR69 pKa = 11.84VMPTAKK75 pKa = 10.05RR76 pKa = 11.84VGLTANRR83 pKa = 11.84IVLTANRR90 pKa = 11.84VVLTANRR97 pKa = 11.84VVLTANRR104 pKa = 11.84VVLTANRR111 pKa = 11.84VVLTANRR118 pKa = 11.84VGLTANRR125 pKa = 11.84VVLTANRR132 pKa = 11.84IGLTANRR139 pKa = 11.84VVLTANRR146 pKa = 11.84VRR148 pKa = 11.84LTVNRR153 pKa = 11.84IGLTANRR160 pKa = 11.84IRR162 pKa = 11.84LTANRR167 pKa = 11.84TGLVVNTIPP176 pKa = 4.74
Molecular weight: 19.0 kDa
Isoelectric point according different methods:
Peptides (in silico digests for buttom-up proteomics)
Below you can find in silico digests of the whole proteome with Trypsin, Chymotrypsin, Trypsin+LysC, LysN, ArgC proteases suitable for different mass spec machines.| Try ESI |
 |
|---|
| ChTry ESI |
 |
|---|
| ArgC ESI |
 |
|---|
| LysN ESI |
 |
|---|
| TryLysC ESI |
 |
|---|
| Try MALDI |
 |
|---|
| ChTry MALDI |
 |
|---|
| ArgC MALDI |
 |
|---|
| LysN MALDI |
 |
|---|
| TryLysC MALDI |
 |
|---|
| Try LTQ |
 |
|---|
| ChTry LTQ |
 |
|---|
| ArgC LTQ |
 |
|---|
| LysN LTQ |
 |
|---|
| TryLysC LTQ |
 |
|---|
| Try MSlow |
 |
|---|
| ChTry MSlow |
 |
|---|
| ArgC MSlow |
 |
|---|
| LysN MSlow |
 |
|---|
| TryLysC MSlow |
 |
|---|
| Try MShigh |
 |
|---|
| ChTry MShigh |
 |
|---|
| ArgC MShigh |
 |
|---|
| LysN MShigh |
 |
|---|
| TryLysC MShigh |
 |
|---|
General Statistics
Number of major isoforms |
Number of additional isoforms |
Number of all proteins |
Number of amino acids |
Min. Seq. Length |
Max. Seq. Length |
Avg. Seq. Length |
Avg. Mol. Weight |
|---|---|---|---|---|---|---|---|
0 |
1479298 |
21 |
3749 |
351.2 |
39.59 |
Amino acid frequency
Ala |
Cys |
Asp |
Glu |
Phe |
Gly |
His |
Ile |
Lys |
Leu |
|---|---|---|---|---|---|---|---|---|---|
6.901 ± 0.033 | 0.746 ± 0.011 |
5.704 ± 0.026 | 6.735 ± 0.039 |
4.834 ± 0.028 | 7.162 ± 0.038 |
2.021 ± 0.02 | 6.973 ± 0.033 |
6.531 ± 0.048 | 9.127 ± 0.036 |
Met |
Asn |
Gln |
Pro |
Arg |
Ser |
Thr |
Val |
Trp |
Tyr |
|---|---|---|---|---|---|---|---|---|---|
2.354 ± 0.018 | 5.077 ± 0.037 |
3.844 ± 0.021 | 3.3 ± 0.02 |
4.719 ± 0.029 | 6.12 ± 0.031 |
5.846 ± 0.031 | 6.462 ± 0.029 |
1.201 ± 0.014 | 4.343 ± 0.029 |
Most of the basic statistics you can see at this page can be downloaded from this CSV file
Proteome-pI is available under Creative Commons Attribution-NoDerivs license, for more details see here
| Reference: Kozlowski LP. Proteome-pI 2.0: Proteome Isoelectric Point Database Update. Nucleic Acids Res. 2021, doi: 10.1093/nar/gkab944 | Contact: Lukasz P. Kozlowski |
