Mycolicibacterium anyangense
Taxonomy: cellular organisms; Bacteria; Terrabacteria group; Actinobacteria; Actinomycetia; Corynebacteriales; Mycobacteriaceae; Mycolicibacterium
Average proteome isoelectric point is 6.0
Get precalculated fractions of proteins

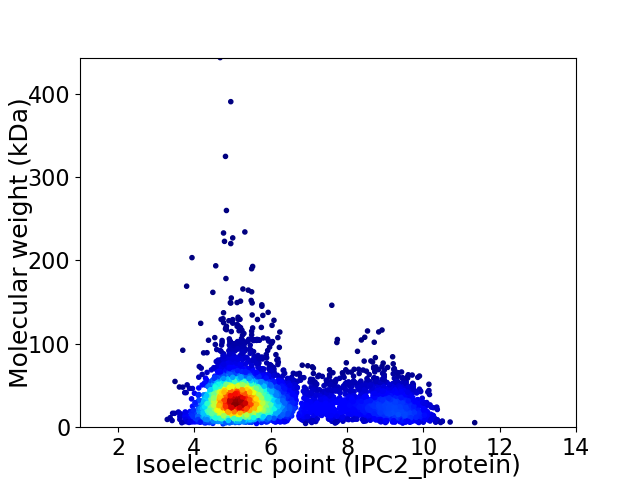
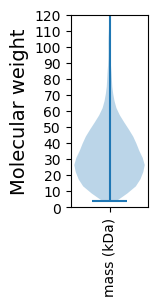
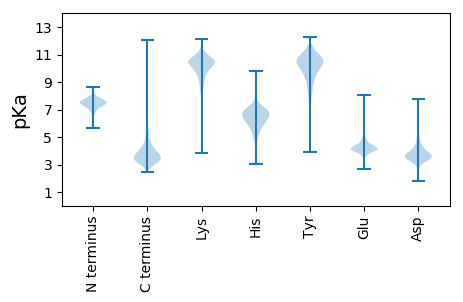
Virtual 2D-PAGE plot for 5421 proteins (isoelectric point calculated using IPC2_protein)
Get csv file with sequences according to given criteria:
* You can choose from 21 different methods for calculating isoelectric point
Summary statistics related to proteome-wise predictions


Protein with the lowest isoelectric point:
>tr|A0A6N4W9W8|A0A6N4W9W8_9MYCO ESX-2 secretion system ATPase EccB2 OS=Mycolicibacterium anyangense OX=1431246 GN=eccB2 PE=3 SV=1
MM1 pKa = 7.09VRR3 pKa = 11.84SLHH6 pKa = 6.43AAPQASISLPTIPSGVAGLALTSAVEE32 pKa = 3.93LALAATVSVINALAPSPTRR51 pKa = 11.84VSSTLDD57 pKa = 3.47LNGDD61 pKa = 3.89TVIASSPEE69 pKa = 3.94QVTSFYY75 pKa = 11.21GRR77 pKa = 11.84WTYY80 pKa = 11.29LPGAPSVVQGEE91 pKa = 4.24QQFAVVDD98 pKa = 4.43PKK100 pKa = 10.83TGTSAGSFDD109 pKa = 3.97ALVSRR114 pKa = 11.84GNGYY118 pKa = 10.59NYY120 pKa = 10.34TEE122 pKa = 4.63LLVTSDD128 pKa = 3.31EE129 pKa = 4.32GSNVGTGAGQLPPVGSLISSFGIGPVTLSYY159 pKa = 10.07TAIPTGSGDD168 pKa = 3.39KK169 pKa = 10.97VSFRR173 pKa = 11.84LVTPLGSLALPMPFDD188 pKa = 3.88AAAGIADD195 pKa = 3.85YY196 pKa = 11.1SVDD199 pKa = 3.52SRR201 pKa = 11.84PVQLTNGYY209 pKa = 9.46SIAPAVSTPEE219 pKa = 4.25TYY221 pKa = 10.15TGTSGILPFFTTVQGRR237 pKa = 11.84QVFTIDD243 pKa = 3.3NPAGVPVGSFEE254 pKa = 4.75GVVTTTADD262 pKa = 2.9ILGTYY267 pKa = 7.26TQAILVTANDD277 pKa = 4.14GTNVGLDD284 pKa = 3.6PGQVPPVGSVYY295 pKa = 10.65NVVYY299 pKa = 10.61SGSDD303 pKa = 3.14QNYY306 pKa = 8.44VLYY309 pKa = 10.96SSMPAQSGDD318 pKa = 3.46PVAVSQVSSGAVATSDD334 pKa = 3.62LTLIDD339 pKa = 4.84ASEE342 pKa = 4.2QPATQPFTGPNGTTFVPVSTLQPTGVNGLPPRR374 pKa = 11.84EE375 pKa = 3.98VQIQGYY381 pKa = 7.14QQFAVYY387 pKa = 10.03DD388 pKa = 3.77SAGTRR393 pKa = 11.84IGSVDD398 pKa = 3.64ADD400 pKa = 4.37VYY402 pKa = 10.17SQWDD406 pKa = 3.49LLGIRR411 pKa = 11.84SQAILVTDD419 pKa = 3.83VTAGTTGTSAGQVPAVGSEE438 pKa = 3.96FNVVDD443 pKa = 4.62FGTSGFATADD453 pKa = 3.5SVTPTPTGDD462 pKa = 3.36VNSFSILTPVGNSPTLSIYY481 pKa = 10.59TKK483 pKa = 9.01VADD486 pKa = 4.03RR487 pKa = 11.84AGVTFADD494 pKa = 4.31PFTTVV499 pKa = 2.52
MM1 pKa = 7.09VRR3 pKa = 11.84SLHH6 pKa = 6.43AAPQASISLPTIPSGVAGLALTSAVEE32 pKa = 3.93LALAATVSVINALAPSPTRR51 pKa = 11.84VSSTLDD57 pKa = 3.47LNGDD61 pKa = 3.89TVIASSPEE69 pKa = 3.94QVTSFYY75 pKa = 11.21GRR77 pKa = 11.84WTYY80 pKa = 11.29LPGAPSVVQGEE91 pKa = 4.24QQFAVVDD98 pKa = 4.43PKK100 pKa = 10.83TGTSAGSFDD109 pKa = 3.97ALVSRR114 pKa = 11.84GNGYY118 pKa = 10.59NYY120 pKa = 10.34TEE122 pKa = 4.63LLVTSDD128 pKa = 3.31EE129 pKa = 4.32GSNVGTGAGQLPPVGSLISSFGIGPVTLSYY159 pKa = 10.07TAIPTGSGDD168 pKa = 3.39KK169 pKa = 10.97VSFRR173 pKa = 11.84LVTPLGSLALPMPFDD188 pKa = 3.88AAAGIADD195 pKa = 3.85YY196 pKa = 11.1SVDD199 pKa = 3.52SRR201 pKa = 11.84PVQLTNGYY209 pKa = 9.46SIAPAVSTPEE219 pKa = 4.25TYY221 pKa = 10.15TGTSGILPFFTTVQGRR237 pKa = 11.84QVFTIDD243 pKa = 3.3NPAGVPVGSFEE254 pKa = 4.75GVVTTTADD262 pKa = 2.9ILGTYY267 pKa = 7.26TQAILVTANDD277 pKa = 4.14GTNVGLDD284 pKa = 3.6PGQVPPVGSVYY295 pKa = 10.65NVVYY299 pKa = 10.61SGSDD303 pKa = 3.14QNYY306 pKa = 8.44VLYY309 pKa = 10.96SSMPAQSGDD318 pKa = 3.46PVAVSQVSSGAVATSDD334 pKa = 3.62LTLIDD339 pKa = 4.84ASEE342 pKa = 4.2QPATQPFTGPNGTTFVPVSTLQPTGVNGLPPRR374 pKa = 11.84EE375 pKa = 3.98VQIQGYY381 pKa = 7.14QQFAVYY387 pKa = 10.03DD388 pKa = 3.77SAGTRR393 pKa = 11.84IGSVDD398 pKa = 3.64ADD400 pKa = 4.37VYY402 pKa = 10.17SQWDD406 pKa = 3.49LLGIRR411 pKa = 11.84SQAILVTDD419 pKa = 3.83VTAGTTGTSAGQVPAVGSEE438 pKa = 3.96FNVVDD443 pKa = 4.62FGTSGFATADD453 pKa = 3.5SVTPTPTGDD462 pKa = 3.36VNSFSILTPVGNSPTLSIYY481 pKa = 10.59TKK483 pKa = 9.01VADD486 pKa = 4.03RR487 pKa = 11.84AGVTFADD494 pKa = 4.31PFTTVV499 pKa = 2.52
Molecular weight: 50.77 kDa
Isoelectric point according different methods:
Protein with the highest isoelectric point:
>tr|A0A6N4W950|A0A6N4W950_9MYCO HTH tetR-type domain-containing protein OS=Mycolicibacterium anyangense OX=1431246 GN=MANY_20140 PE=4 SV=1
MM1 pKa = 7.69AKK3 pKa = 10.06GKK5 pKa = 8.69RR6 pKa = 11.84TFQPNNRR13 pKa = 11.84RR14 pKa = 11.84RR15 pKa = 11.84ARR17 pKa = 11.84VHH19 pKa = 5.99GFRR22 pKa = 11.84LRR24 pKa = 11.84MRR26 pKa = 11.84TRR28 pKa = 11.84AGRR31 pKa = 11.84AIVSARR37 pKa = 11.84RR38 pKa = 11.84GKK40 pKa = 10.38GRR42 pKa = 11.84RR43 pKa = 11.84SLTAA47 pKa = 3.9
MM1 pKa = 7.69AKK3 pKa = 10.06GKK5 pKa = 8.69RR6 pKa = 11.84TFQPNNRR13 pKa = 11.84RR14 pKa = 11.84RR15 pKa = 11.84ARR17 pKa = 11.84VHH19 pKa = 5.99GFRR22 pKa = 11.84LRR24 pKa = 11.84MRR26 pKa = 11.84TRR28 pKa = 11.84AGRR31 pKa = 11.84AIVSARR37 pKa = 11.84RR38 pKa = 11.84GKK40 pKa = 10.38GRR42 pKa = 11.84RR43 pKa = 11.84SLTAA47 pKa = 3.9
Molecular weight: 5.46 kDa
Isoelectric point according different methods:
Peptides (in silico digests for buttom-up proteomics)
Below you can find in silico digests of the whole proteome with Trypsin, Chymotrypsin, Trypsin+LysC, LysN, ArgC proteases suitable for different mass spec machines.| Try ESI |
 |
|---|
| ChTry ESI |
 |
|---|
| ArgC ESI |
 |
|---|
| LysN ESI |
 |
|---|
| TryLysC ESI |
 |
|---|
| Try MALDI |
 |
|---|
| ChTry MALDI |
 |
|---|
| ArgC MALDI |
 |
|---|
| LysN MALDI |
 |
|---|
| TryLysC MALDI |
 |
|---|
| Try LTQ |
 |
|---|
| ChTry LTQ |
 |
|---|
| ArgC LTQ |
 |
|---|
| LysN LTQ |
 |
|---|
| TryLysC LTQ |
 |
|---|
| Try MSlow |
 |
|---|
| ChTry MSlow |
 |
|---|
| ArgC MSlow |
 |
|---|
| LysN MSlow |
 |
|---|
| TryLysC MSlow |
 |
|---|
| Try MShigh |
 |
|---|
| ChTry MShigh |
 |
|---|
| ArgC MShigh |
 |
|---|
| LysN MShigh |
 |
|---|
| TryLysC MShigh |
 |
|---|
General Statistics
Number of major isoforms |
Number of additional isoforms |
Number of all proteins |
Number of amino acids |
Min. Seq. Length |
Max. Seq. Length |
Avg. Seq. Length |
Avg. Mol. Weight |
|---|---|---|---|---|---|---|---|
0 |
1769607 |
40 |
4157 |
326.4 |
34.92 |
Amino acid frequency
Ala |
Cys |
Asp |
Glu |
Phe |
Gly |
His |
Ile |
Lys |
Leu |
|---|---|---|---|---|---|---|---|---|---|
13.115 ± 0.05 | 0.803 ± 0.009 |
6.189 ± 0.025 | 4.971 ± 0.033 |
3.065 ± 0.02 | 9.021 ± 0.058 |
2.163 ± 0.013 | 4.399 ± 0.022 |
2.148 ± 0.021 | 9.872 ± 0.031 |
Met |
Asn |
Gln |
Pro |
Arg |
Ser |
Thr |
Val |
Trp |
Tyr |
|---|---|---|---|---|---|---|---|---|---|
2.007 ± 0.013 | 2.294 ± 0.02 |
5.834 ± 0.031 | 3.074 ± 0.019 |
6.881 ± 0.033 | 5.532 ± 0.023 |
6.187 ± 0.022 | 8.781 ± 0.033 |
1.506 ± 0.013 | 2.158 ± 0.016 |
Most of the basic statistics you can see at this page can be downloaded from this CSV file
Proteome-pI is available under Creative Commons Attribution-NoDerivs license, for more details see here
| Reference: Kozlowski LP. Proteome-pI 2.0: Proteome Isoelectric Point Database Update. Nucleic Acids Res. 2021, doi: 10.1093/nar/gkab944 | Contact: Lukasz P. Kozlowski |
