Steroidobacter denitrificans
Taxonomy: cellular organisms; Bacteria; Proteobacteria; Gammaproteobacteria; Nevskiales; Steroidobacteraceae; Steroidobacter
Average proteome isoelectric point is 6.77
Get precalculated fractions of proteins

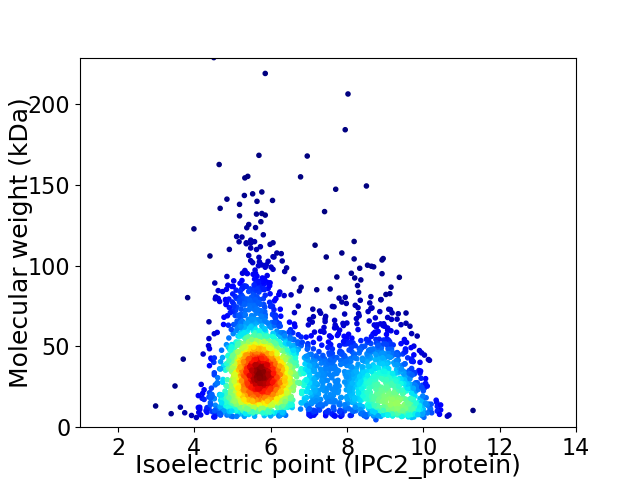
Virtual 2D-PAGE plot for 2956 proteins (isoelectric point calculated using IPC2_protein)
Get csv file with sequences according to given criteria:
* You can choose from 21 different methods for calculating isoelectric point
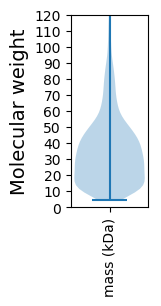
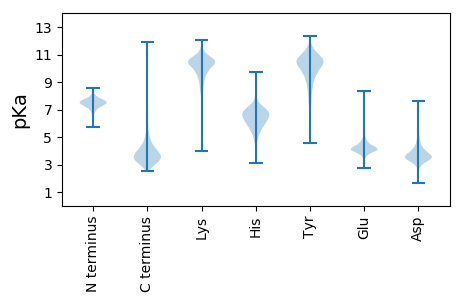
Summary statistics related to proteome-wise predictions


Protein with the lowest isoelectric point:
>tr|A0A127FEE6|A0A127FEE6_STEDE Antitoxin ParD OS=Steroidobacter denitrificans OX=465721 GN=ACG33_14680 PE=3 SV=1
MM1 pKa = 7.35SGAAGEE7 pKa = 4.33EE8 pKa = 4.26TVQRR12 pKa = 11.84VWEE15 pKa = 4.05ALRR18 pKa = 11.84VVIDD22 pKa = 4.02PEE24 pKa = 4.08LGYY27 pKa = 11.13NIVDD31 pKa = 4.13LGLIYY36 pKa = 10.82DD37 pKa = 3.63VDD39 pKa = 4.27VNAEE43 pKa = 4.01GAAHH47 pKa = 7.27IMMTTTTRR55 pKa = 11.84GCPATHH61 pKa = 6.34YY62 pKa = 9.4LQTGAYY68 pKa = 7.13EE69 pKa = 4.37AALSTDD75 pKa = 4.89DD76 pKa = 3.35ITSAEE81 pKa = 4.08VEE83 pKa = 4.28MTYY86 pKa = 10.84DD87 pKa = 3.83PPWNPGMMRR96 pKa = 11.84PEE98 pKa = 4.0AKK100 pKa = 10.18AHH102 pKa = 6.44FGIPDD107 pKa = 3.55DD108 pKa = 3.92
MM1 pKa = 7.35SGAAGEE7 pKa = 4.33EE8 pKa = 4.26TVQRR12 pKa = 11.84VWEE15 pKa = 4.05ALRR18 pKa = 11.84VVIDD22 pKa = 4.02PEE24 pKa = 4.08LGYY27 pKa = 11.13NIVDD31 pKa = 4.13LGLIYY36 pKa = 10.82DD37 pKa = 3.63VDD39 pKa = 4.27VNAEE43 pKa = 4.01GAAHH47 pKa = 7.27IMMTTTTRR55 pKa = 11.84GCPATHH61 pKa = 6.34YY62 pKa = 9.4LQTGAYY68 pKa = 7.13EE69 pKa = 4.37AALSTDD75 pKa = 4.89DD76 pKa = 3.35ITSAEE81 pKa = 4.08VEE83 pKa = 4.28MTYY86 pKa = 10.84DD87 pKa = 3.83PPWNPGMMRR96 pKa = 11.84PEE98 pKa = 4.0AKK100 pKa = 10.18AHH102 pKa = 6.44FGIPDD107 pKa = 3.55DD108 pKa = 3.92
Molecular weight: 11.75 kDa
Isoelectric point according different methods:
Protein with the highest isoelectric point:
>tr|A0A127F5I7|A0A127F5I7_STEDE Uncharacterized protein OS=Steroidobacter denitrificans OX=465721 GN=ACG33_01000 PE=4 SV=1
MM1 pKa = 6.38ATKK4 pKa = 10.41RR5 pKa = 11.84KK6 pKa = 9.4VSKK9 pKa = 10.37KK10 pKa = 9.58KK11 pKa = 10.33AGAKK15 pKa = 9.82RR16 pKa = 11.84KK17 pKa = 8.31VAKK20 pKa = 9.28TAVKK24 pKa = 10.33KK25 pKa = 10.55KK26 pKa = 8.81VARR29 pKa = 11.84TAAKK33 pKa = 10.03KK34 pKa = 10.1KK35 pKa = 8.91VAKK38 pKa = 10.32APRR41 pKa = 11.84KK42 pKa = 8.14VAKK45 pKa = 10.38KK46 pKa = 9.77KK47 pKa = 8.93VAKK50 pKa = 9.19TAVKK54 pKa = 10.33KK55 pKa = 10.55KK56 pKa = 8.81VARR59 pKa = 11.84TAAKK63 pKa = 10.03KK64 pKa = 10.1KK65 pKa = 8.91VAKK68 pKa = 10.32APRR71 pKa = 11.84KK72 pKa = 8.33VAKK75 pKa = 10.07KK76 pKa = 10.0KK77 pKa = 10.76AGAKK81 pKa = 9.77KK82 pKa = 9.77SAAKK86 pKa = 9.85RR87 pKa = 11.84RR88 pKa = 11.84SASVVRR94 pKa = 11.84APQQ97 pKa = 3.08
MM1 pKa = 6.38ATKK4 pKa = 10.41RR5 pKa = 11.84KK6 pKa = 9.4VSKK9 pKa = 10.37KK10 pKa = 9.58KK11 pKa = 10.33AGAKK15 pKa = 9.82RR16 pKa = 11.84KK17 pKa = 8.31VAKK20 pKa = 9.28TAVKK24 pKa = 10.33KK25 pKa = 10.55KK26 pKa = 8.81VARR29 pKa = 11.84TAAKK33 pKa = 10.03KK34 pKa = 10.1KK35 pKa = 8.91VAKK38 pKa = 10.32APRR41 pKa = 11.84KK42 pKa = 8.14VAKK45 pKa = 10.38KK46 pKa = 9.77KK47 pKa = 8.93VAKK50 pKa = 9.19TAVKK54 pKa = 10.33KK55 pKa = 10.55KK56 pKa = 8.81VARR59 pKa = 11.84TAAKK63 pKa = 10.03KK64 pKa = 10.1KK65 pKa = 8.91VAKK68 pKa = 10.32APRR71 pKa = 11.84KK72 pKa = 8.33VAKK75 pKa = 10.07KK76 pKa = 10.0KK77 pKa = 10.76AGAKK81 pKa = 9.77KK82 pKa = 9.77SAAKK86 pKa = 9.85RR87 pKa = 11.84RR88 pKa = 11.84SASVVRR94 pKa = 11.84APQQ97 pKa = 3.08
Molecular weight: 10.37 kDa
Isoelectric point according different methods:
Peptides (in silico digests for buttom-up proteomics)
Below you can find in silico digests of the whole proteome with Trypsin, Chymotrypsin, Trypsin+LysC, LysN, ArgC proteases suitable for different mass spec machines.| Try ESI |
 |
|---|
| ChTry ESI |
 |
|---|
| ArgC ESI |
 |
|---|
| LysN ESI |
 |
|---|
| TryLysC ESI |
 |
|---|
| Try MALDI |
 |
|---|
| ChTry MALDI |
 |
|---|
| ArgC MALDI |
 |
|---|
| LysN MALDI |
 |
|---|
| TryLysC MALDI |
 |
|---|
| Try LTQ |
 |
|---|
| ChTry LTQ |
 |
|---|
| ArgC LTQ |
 |
|---|
| LysN LTQ |
 |
|---|
| TryLysC LTQ |
 |
|---|
| Try MSlow |
 |
|---|
| ChTry MSlow |
 |
|---|
| ArgC MSlow |
 |
|---|
| LysN MSlow |
 |
|---|
| TryLysC MSlow |
 |
|---|
| Try MShigh |
 |
|---|
| ChTry MShigh |
 |
|---|
| ArgC MShigh |
 |
|---|
| LysN MShigh |
 |
|---|
| TryLysC MShigh |
 |
|---|
General Statistics
Number of major isoforms |
Number of additional isoforms |
Number of all proteins |
Number of amino acids |
Min. Seq. Length |
Max. Seq. Length |
Avg. Seq. Length |
Avg. Mol. Weight |
|---|---|---|---|---|---|---|---|
0 |
988673 |
41 |
2117 |
334.5 |
36.69 |
Amino acid frequency
Ala |
Cys |
Asp |
Glu |
Phe |
Gly |
His |
Ile |
Lys |
Leu |
|---|---|---|---|---|---|---|---|---|---|
11.818 ± 0.051 | 0.972 ± 0.017 |
5.498 ± 0.026 | 5.923 ± 0.042 |
3.444 ± 0.03 | 8.08 ± 0.035 |
2.303 ± 0.021 | 5.108 ± 0.032 |
2.771 ± 0.032 | 10.738 ± 0.047 |
Met |
Asn |
Gln |
Pro |
Arg |
Ser |
Thr |
Val |
Trp |
Tyr |
|---|---|---|---|---|---|---|---|---|---|
2.377 ± 0.021 | 2.496 ± 0.024 |
5.014 ± 0.027 | 3.864 ± 0.03 |
8.166 ± 0.038 | 5.496 ± 0.03 |
5.015 ± 0.026 | 7.143 ± 0.035 |
1.338 ± 0.021 | 2.437 ± 0.024 |
Most of the basic statistics you can see at this page can be downloaded from this CSV file
Proteome-pI is available under Creative Commons Attribution-NoDerivs license, for more details see here
| Reference: Kozlowski LP. Proteome-pI 2.0: Proteome Isoelectric Point Database Update. Nucleic Acids Res. 2021, doi: 10.1093/nar/gkab944 | Contact: Lukasz P. Kozlowski |
