Rhizobium album
Taxonomy: cellular organisms; Bacteria; Proteobacteria; Alphaproteobacteria; Hyphomicrobiales; Rhizobiaceae; Rhizobium/Agrobacterium group; Rhizobium
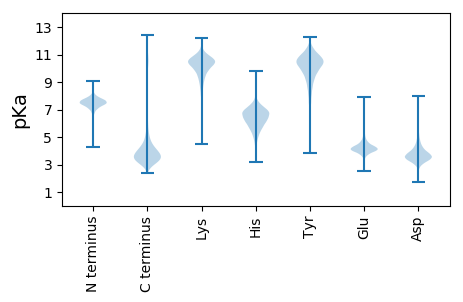
Average proteome isoelectric point is 6.4
Get precalculated fractions of proteins

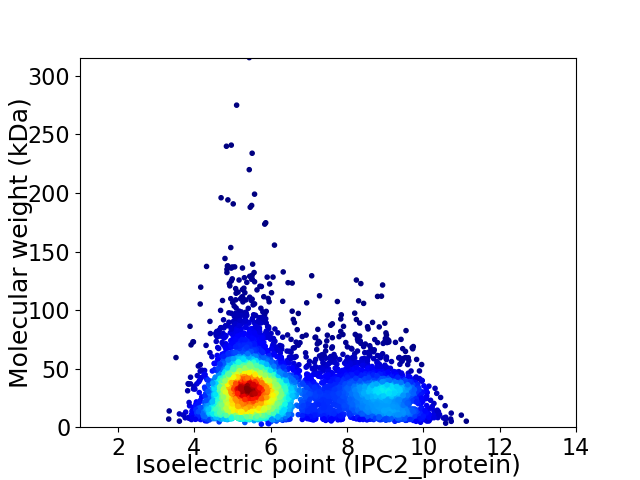
Virtual 2D-PAGE plot for 6427 proteins (isoelectric point calculated using IPC2_protein)
Get csv file with sequences according to given criteria:
* You can choose from 21 different methods for calculating isoelectric point
Summary statistics related to proteome-wise predictions


Protein with the lowest isoelectric point:
>tr|A0A2U2DY48|A0A2U2DY48_9RHIZ DUF3563 domain-containing protein OS=Rhizobium album OX=2182425 GN=DEM27_03525 PE=4 SV=1
MM1 pKa = 7.49NIKK4 pKa = 10.39SLLLGSAAALAVVSGAQAADD24 pKa = 4.21AIVAAEE30 pKa = 4.47PEE32 pKa = 3.93PMEE35 pKa = 4.1YY36 pKa = 10.8VRR38 pKa = 11.84VCDD41 pKa = 4.42AFGTGYY47 pKa = 10.47FYY49 pKa = 10.57IPGTEE54 pKa = 3.81TCLKK58 pKa = 9.41VGGRR62 pKa = 11.84VRR64 pKa = 11.84FDD66 pKa = 3.06VQAADD71 pKa = 3.78SYY73 pKa = 11.85SPNSDD78 pKa = 3.37NGWNTRR84 pKa = 11.84SRR86 pKa = 11.84AEE88 pKa = 4.51LYY90 pKa = 10.68LDD92 pKa = 3.62SASDD96 pKa = 3.65TEE98 pKa = 4.38YY99 pKa = 11.35GALKK103 pKa = 8.16TQIVARR109 pKa = 11.84WDD111 pKa = 3.24FDD113 pKa = 3.64GDD115 pKa = 4.15YY116 pKa = 11.32NDD118 pKa = 4.64GQHH121 pKa = 5.47TTSKK125 pKa = 10.77LIAANITLAGFLVGLADD142 pKa = 3.52SQYY145 pKa = 11.16TSFTGYY151 pKa = 10.87AGDD154 pKa = 4.93IINDD158 pKa = 3.53DD159 pKa = 3.83VIAYY163 pKa = 10.22GEE165 pKa = 4.32FEE167 pKa = 4.53VNQISYY173 pKa = 9.12TYY175 pKa = 10.7DD176 pKa = 3.14GGNGFTAVISLEE188 pKa = 4.18DD189 pKa = 3.87DD190 pKa = 3.31SRR192 pKa = 11.84TGDD195 pKa = 3.51DD196 pKa = 3.62YY197 pKa = 11.53MVDD200 pKa = 3.46VVGGIGYY207 pKa = 7.79STGTFGFKK215 pKa = 10.49VVGGYY220 pKa = 10.12DD221 pKa = 3.36EE222 pKa = 4.6SAEE225 pKa = 4.02EE226 pKa = 4.13GAIKK230 pKa = 10.53ARR232 pKa = 11.84LDD234 pKa = 3.72GNFGALSAFLMAGWNSDD251 pKa = 2.61GDD253 pKa = 4.37VVHH256 pKa = 7.01KK257 pKa = 8.36FAPSNFGGAAAGIGWGDD274 pKa = 3.33WAVWGGLGYY283 pKa = 10.66SFSDD287 pKa = 3.2TLAANLQLAYY297 pKa = 9.65TDD299 pKa = 4.09SEE301 pKa = 4.78VFAAAANVKK310 pKa = 8.52WNPVPGLLIQPEE322 pKa = 4.04ITYY325 pKa = 8.19TNWDD329 pKa = 4.52SIDD332 pKa = 3.5EE333 pKa = 4.3DD334 pKa = 3.35QWNGMVRR341 pKa = 11.84FQRR344 pKa = 11.84TFF346 pKa = 2.79
MM1 pKa = 7.49NIKK4 pKa = 10.39SLLLGSAAALAVVSGAQAADD24 pKa = 4.21AIVAAEE30 pKa = 4.47PEE32 pKa = 3.93PMEE35 pKa = 4.1YY36 pKa = 10.8VRR38 pKa = 11.84VCDD41 pKa = 4.42AFGTGYY47 pKa = 10.47FYY49 pKa = 10.57IPGTEE54 pKa = 3.81TCLKK58 pKa = 9.41VGGRR62 pKa = 11.84VRR64 pKa = 11.84FDD66 pKa = 3.06VQAADD71 pKa = 3.78SYY73 pKa = 11.85SPNSDD78 pKa = 3.37NGWNTRR84 pKa = 11.84SRR86 pKa = 11.84AEE88 pKa = 4.51LYY90 pKa = 10.68LDD92 pKa = 3.62SASDD96 pKa = 3.65TEE98 pKa = 4.38YY99 pKa = 11.35GALKK103 pKa = 8.16TQIVARR109 pKa = 11.84WDD111 pKa = 3.24FDD113 pKa = 3.64GDD115 pKa = 4.15YY116 pKa = 11.32NDD118 pKa = 4.64GQHH121 pKa = 5.47TTSKK125 pKa = 10.77LIAANITLAGFLVGLADD142 pKa = 3.52SQYY145 pKa = 11.16TSFTGYY151 pKa = 10.87AGDD154 pKa = 4.93IINDD158 pKa = 3.53DD159 pKa = 3.83VIAYY163 pKa = 10.22GEE165 pKa = 4.32FEE167 pKa = 4.53VNQISYY173 pKa = 9.12TYY175 pKa = 10.7DD176 pKa = 3.14GGNGFTAVISLEE188 pKa = 4.18DD189 pKa = 3.87DD190 pKa = 3.31SRR192 pKa = 11.84TGDD195 pKa = 3.51DD196 pKa = 3.62YY197 pKa = 11.53MVDD200 pKa = 3.46VVGGIGYY207 pKa = 7.79STGTFGFKK215 pKa = 10.49VVGGYY220 pKa = 10.12DD221 pKa = 3.36EE222 pKa = 4.6SAEE225 pKa = 4.02EE226 pKa = 4.13GAIKK230 pKa = 10.53ARR232 pKa = 11.84LDD234 pKa = 3.72GNFGALSAFLMAGWNSDD251 pKa = 2.61GDD253 pKa = 4.37VVHH256 pKa = 7.01KK257 pKa = 8.36FAPSNFGGAAAGIGWGDD274 pKa = 3.33WAVWGGLGYY283 pKa = 10.66SFSDD287 pKa = 3.2TLAANLQLAYY297 pKa = 9.65TDD299 pKa = 4.09SEE301 pKa = 4.78VFAAAANVKK310 pKa = 8.52WNPVPGLLIQPEE322 pKa = 4.04ITYY325 pKa = 8.19TNWDD329 pKa = 4.52SIDD332 pKa = 3.5EE333 pKa = 4.3DD334 pKa = 3.35QWNGMVRR341 pKa = 11.84FQRR344 pKa = 11.84TFF346 pKa = 2.79
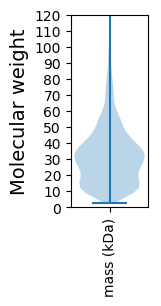
Molecular weight: 36.99 kDa
Isoelectric point according different methods:
Protein with the highest isoelectric point:
>tr|A0A2U2DRW5|A0A2U2DRW5_9RHIZ Ubiquinone/menaquinone biosynthesis C-methyltransferase UbiE OS=Rhizobium album OX=2182425 GN=ubiE PE=3 SV=1
MM1 pKa = 7.35KK2 pKa = 9.43RR3 pKa = 11.84TYY5 pKa = 10.27QPSKK9 pKa = 9.73LVRR12 pKa = 11.84KK13 pKa = 9.15RR14 pKa = 11.84RR15 pKa = 11.84HH16 pKa = 4.42GFRR19 pKa = 11.84ARR21 pKa = 11.84MATNGGQKK29 pKa = 9.78VLAARR34 pKa = 11.84RR35 pKa = 11.84ARR37 pKa = 11.84GRR39 pKa = 11.84KK40 pKa = 9.03RR41 pKa = 11.84LSAA44 pKa = 4.03
MM1 pKa = 7.35KK2 pKa = 9.43RR3 pKa = 11.84TYY5 pKa = 10.27QPSKK9 pKa = 9.73LVRR12 pKa = 11.84KK13 pKa = 9.15RR14 pKa = 11.84RR15 pKa = 11.84HH16 pKa = 4.42GFRR19 pKa = 11.84ARR21 pKa = 11.84MATNGGQKK29 pKa = 9.78VLAARR34 pKa = 11.84RR35 pKa = 11.84ARR37 pKa = 11.84GRR39 pKa = 11.84KK40 pKa = 9.03RR41 pKa = 11.84LSAA44 pKa = 4.03
Molecular weight: 5.12 kDa
Isoelectric point according different methods:
Peptides (in silico digests for buttom-up proteomics)
Below you can find in silico digests of the whole proteome with Trypsin, Chymotrypsin, Trypsin+LysC, LysN, ArgC proteases suitable for different mass spec machines.| Try ESI |
 |
|---|
| ChTry ESI |
 |
|---|
| ArgC ESI |
 |
|---|
| LysN ESI |
 |
|---|
| TryLysC ESI |
 |
|---|
| Try MALDI |
 |
|---|
| ChTry MALDI |
 |
|---|
| ArgC MALDI |
 |
|---|
| LysN MALDI |
 |
|---|
| TryLysC MALDI |
 |
|---|
| Try LTQ |
 |
|---|
| ChTry LTQ |
 |
|---|
| ArgC LTQ |
 |
|---|
| LysN LTQ |
 |
|---|
| TryLysC LTQ |
 |
|---|
| Try MSlow |
 |
|---|
| ChTry MSlow |
 |
|---|
| ArgC MSlow |
 |
|---|
| LysN MSlow |
 |
|---|
| TryLysC MSlow |
 |
|---|
| Try MShigh |
 |
|---|
| ChTry MShigh |
 |
|---|
| ArgC MShigh |
 |
|---|
| LysN MShigh |
 |
|---|
| TryLysC MShigh |
 |
|---|
General Statistics
Number of major isoforms |
Number of additional isoforms |
Number of all proteins |
Number of amino acids |
Min. Seq. Length |
Max. Seq. Length |
Avg. Seq. Length |
Avg. Mol. Weight |
|---|---|---|---|---|---|---|---|
0 |
1993445 |
23 |
2835 |
310.2 |
33.75 |
Amino acid frequency
Ala |
Cys |
Asp |
Glu |
Phe |
Gly |
His |
Ile |
Lys |
Leu |
|---|---|---|---|---|---|---|---|---|---|
11.965 ± 0.038 | 0.829 ± 0.008 |
5.789 ± 0.025 | 5.832 ± 0.024 |
3.899 ± 0.02 | 8.412 ± 0.023 |
2.003 ± 0.015 | 5.636 ± 0.023 |
3.688 ± 0.023 | 9.869 ± 0.036 |
Met |
Asn |
Gln |
Pro |
Arg |
Ser |
Thr |
Val |
Trp |
Tyr |
|---|---|---|---|---|---|---|---|---|---|
2.583 ± 0.016 | 2.816 ± 0.016 |
4.781 ± 0.02 | 3.132 ± 0.019 |
6.766 ± 0.032 | 5.718 ± 0.02 |
5.393 ± 0.018 | 7.316 ± 0.026 |
1.272 ± 0.012 | 2.303 ± 0.016 |
Most of the basic statistics you can see at this page can be downloaded from this CSV file
Proteome-pI is available under Creative Commons Attribution-NoDerivs license, for more details see here
| Reference: Kozlowski LP. Proteome-pI 2.0: Proteome Isoelectric Point Database Update. Nucleic Acids Res. 2021, doi: 10.1093/nar/gkab944 | Contact: Lukasz P. Kozlowski |
