Saccharibacter sp. 17.LH.SD
Taxonomy: cellular organisms; Bacteria; Proteobacteria; Alphaproteobacteria; Rhodospirillales; Acetobacteraceae; Saccharibacter; unclassified Saccharibacter
Average proteome isoelectric point is 6.72
Get precalculated fractions of proteins
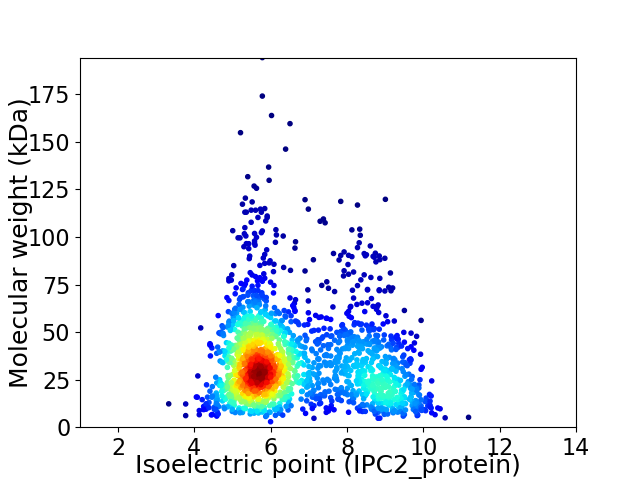
Virtual 2D-PAGE plot for 1859 proteins (isoelectric point calculated using IPC2_protein)
Get csv file with sequences according to given criteria:
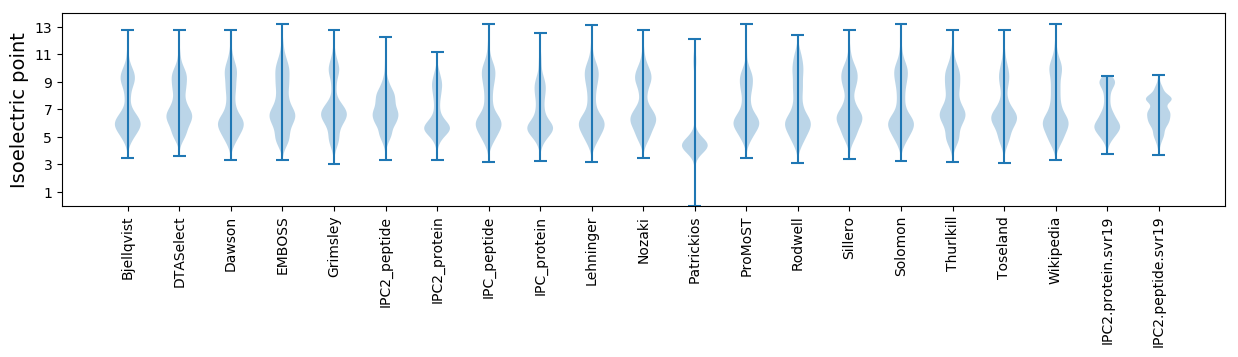
* You can choose from 21 different methods for calculating isoelectric point
Summary statistics related to proteome-wise predictions
Protein with the lowest isoelectric point:
>tr|A0A6I4YWP2|A0A6I4YWP2_9PROT Head protein OS=Saccharibacter sp. 17.LH.SD OX=2689393 GN=GS501_02445 PE=4 SV=1
MM1 pKa = 7.27ATQPVDD7 pKa = 3.44EE8 pKa = 5.49LDD10 pKa = 3.44YY11 pKa = 10.53FYY13 pKa = 11.03QGAVDD18 pKa = 3.9TSEE21 pKa = 5.18LDD23 pKa = 4.84DD24 pKa = 3.94VLTPNDD30 pKa = 3.66SKK32 pKa = 11.7YY33 pKa = 9.54ITLKK37 pKa = 10.43PYY39 pKa = 9.17WRR41 pKa = 11.84EE42 pKa = 3.65PTASPDD48 pKa = 3.65YY49 pKa = 9.07PTGAVV54 pKa = 3.14
MM1 pKa = 7.27ATQPVDD7 pKa = 3.44EE8 pKa = 5.49LDD10 pKa = 3.44YY11 pKa = 10.53FYY13 pKa = 11.03QGAVDD18 pKa = 3.9TSEE21 pKa = 5.18LDD23 pKa = 4.84DD24 pKa = 3.94VLTPNDD30 pKa = 3.66SKK32 pKa = 11.7YY33 pKa = 9.54ITLKK37 pKa = 10.43PYY39 pKa = 9.17WRR41 pKa = 11.84EE42 pKa = 3.65PTASPDD48 pKa = 3.65YY49 pKa = 9.07PTGAVV54 pKa = 3.14
Molecular weight: 6.09 kDa
Isoelectric point according different methods:
Protein with the highest isoelectric point:
>tr|A0A6I4YSP3|A0A6I4YSP3_9PROT Uncharacterized protein OS=Saccharibacter sp. 17.LH.SD OX=2689393 GN=GS501_04975 PE=4 SV=1
MM1 pKa = 7.35KK2 pKa = 9.4RR3 pKa = 11.84TYY5 pKa = 10.2QPSRR9 pKa = 11.84LVRR12 pKa = 11.84KK13 pKa = 9.11RR14 pKa = 11.84RR15 pKa = 11.84HH16 pKa = 4.5GFRR19 pKa = 11.84TRR21 pKa = 11.84SATVGGRR28 pKa = 11.84RR29 pKa = 11.84VLANRR34 pKa = 11.84RR35 pKa = 11.84AKK37 pKa = 9.85GRR39 pKa = 11.84KK40 pKa = 8.87RR41 pKa = 11.84LSAA44 pKa = 3.96
MM1 pKa = 7.35KK2 pKa = 9.4RR3 pKa = 11.84TYY5 pKa = 10.2QPSRR9 pKa = 11.84LVRR12 pKa = 11.84KK13 pKa = 9.11RR14 pKa = 11.84RR15 pKa = 11.84HH16 pKa = 4.5GFRR19 pKa = 11.84TRR21 pKa = 11.84SATVGGRR28 pKa = 11.84RR29 pKa = 11.84VLANRR34 pKa = 11.84RR35 pKa = 11.84AKK37 pKa = 9.85GRR39 pKa = 11.84KK40 pKa = 8.87RR41 pKa = 11.84LSAA44 pKa = 3.96
Molecular weight: 5.19 kDa
Isoelectric point according different methods:
Peptides (in silico digests for buttom-up proteomics)
Below you can find in silico digests of the whole proteome with Trypsin, Chymotrypsin, Trypsin+LysC, LysN, ArgC proteases suitable for different mass spec machines.| Try ESI |
 |
|---|
| ChTry ESI |
|
|---|
| ArgC ESI |
|
|---|
| LysN ESI |
|
|---|
| TryLysC ESI |
|
|---|
| Try MALDI |
|
|---|
| ChTry MALDI |
|
|---|
| ArgC MALDI |
|
|---|
| LysN MALDI |
|
|---|
| TryLysC MALDI |
|
|---|
| Try LTQ |
|
|---|
| ChTry LTQ |
|
|---|
| ArgC LTQ |
|
|---|
| LysN LTQ |
|
|---|
| TryLysC LTQ |
|
|---|
| Try MSlow |
|
|---|
| ChTry MSlow |
|
|---|
| ArgC MSlow |
|
|---|
| LysN MSlow |
|
|---|
| TryLysC MSlow |
|
|---|
| Try MShigh |
|
|---|
| ChTry MShigh |
|
|---|
| ArgC MShigh |
|
|---|
| LysN MShigh |
|
|---|
| TryLysC MShigh |
|
|---|
General Statistics
Number of major isoforms |
Number of additional isoforms |
Number of all proteins |
Number of amino acids |
Min. Seq. Length |
Max. Seq. Length |
Avg. Seq. Length |
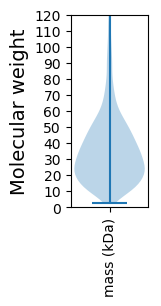
Avg. Mol. Weight |
|---|---|---|---|---|---|---|---|
0 |
618472 |
26 |
1734 |
332.7 |
36.65 |
Amino acid frequency
Ala |
Cys |
Asp |
Glu |
Phe |
Gly |
His |
Ile |
Lys |
Leu |
|---|---|---|---|---|---|---|---|---|---|
9.63 ± 0.063 | 0.993 ± 0.017 |
5.247 ± 0.043 | 5.643 ± 0.062 |
3.73 ± 0.035 | 7.896 ± 0.059 |
2.93 ± 0.032 | 5.618 ± 0.041 |
3.695 ± 0.041 | 10.421 ± 0.071 |
Met |
Asn |
Gln |
Pro |
Arg |
Ser |
Thr |
Val |
Trp |
Tyr |
|---|---|---|---|---|---|---|---|---|---|
2.409 ± 0.024 | 3.194 ± 0.04 |
5.24 ± 0.047 | 4.016 ± 0.037 |
6.61 ± 0.051 | 6.482 ± 0.043 |
5.581 ± 0.046 | 6.793 ± 0.059 |
1.362 ± 0.025 | 2.511 ± 0.037 |
Most of the basic statistics you can see at this page can be downloaded from this CSV file
See this proteome in:

Proteome-pI is available under Creative Commons Attribution-NoDerivs license, for more details see here
| Reference: Kozlowski LP. Proteome-pI 2.0: Proteome Isoelectric Point Database Update. Nucleic Acids Res. 2021, doi: 10.1093/nar/gkab944 | Contact: Lukasz P. Kozlowski |