Canis lupus familiaris (Dog) (Canis familiaris)
Taxonomy: cellular organisms; Eukaryota; Opisthokonta; Metazoa; Eumetazoa; Bilateria; Deuterostomia; Chordata; Craniata; Vertebrata; Gnathostomata; Teleostomi; Euteleostomi; Sarcopterygii; Dipnotetrapodomorpha; Tetrapoda; Amniota; Mammalia;
Average proteome isoelectric point is 6.79
Get precalculated fractions of proteins
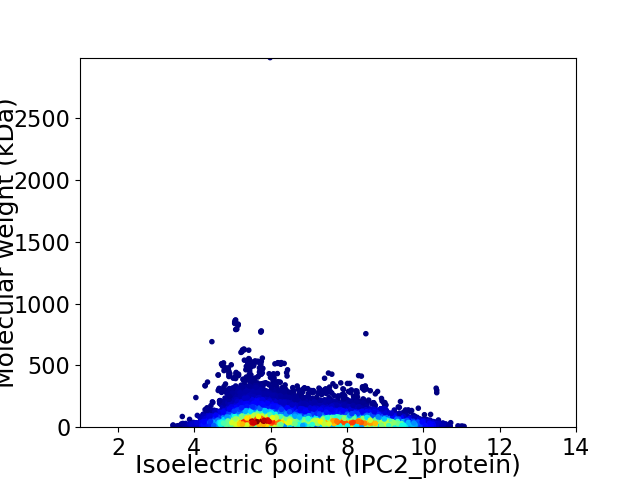
Virtual 2D-PAGE plot for 45399 proteins (isoelectric point calculated using IPC2_protein)
Get csv file with sequences according to given criteria:
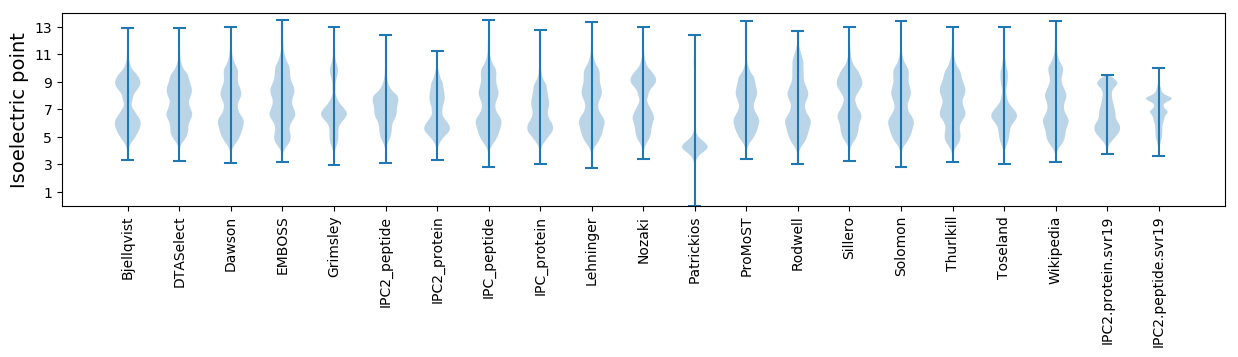
* You can choose from 21 different methods for calculating isoelectric point
Summary statistics related to proteome-wise predictions
Protein with the lowest isoelectric point:
>tr|A0A5F4C8E2|A0A5F4C8E2_CANLF Olfactory receptor OS=Canis lupus familiaris OX=9615 GN=OR4A39 PE=3 SV=1
PP1 pKa = 5.79EE2 pKa = 4.36TKK4 pKa = 10.04TEE6 pKa = 3.76AVLNGKK12 pKa = 8.91GLGTGLLYY20 pKa = 9.53ITEE23 pKa = 4.7SCLSWLDD30 pKa = 3.49GSGLGFSLEE39 pKa = 4.09YY40 pKa = 9.04PTISLHH46 pKa = 6.43AVSRR50 pKa = 11.84DD51 pKa = 3.01LNAYY55 pKa = 8.49PRR57 pKa = 11.84EE58 pKa = 4.02HH59 pKa = 7.32LYY61 pKa = 11.69VMVNAKK67 pKa = 10.12FGQEE71 pKa = 4.03SKK73 pKa = 11.01EE74 pKa = 4.13SVAEE78 pKa = 4.02EE79 pKa = 4.62EE80 pKa = 4.52EE81 pKa = 5.18DD82 pKa = 3.96SDD84 pKa = 6.17DD85 pKa = 3.89DD86 pKa = 4.15VEE88 pKa = 5.15PIAEE92 pKa = 4.09FRR94 pKa = 11.84FVPSDD99 pKa = 3.36KK100 pKa = 10.88SALEE104 pKa = 3.9AMFTAMCEE112 pKa = 4.33CQALHH117 pKa = 7.39PDD119 pKa = 4.25PEE121 pKa = 6.21DD122 pKa = 4.16EE123 pKa = 6.53DD124 pKa = 5.1SDD126 pKa = 5.45DD127 pKa = 4.29YY128 pKa = 11.91DD129 pKa = 4.07GEE131 pKa = 4.35EE132 pKa = 4.51YY133 pKa = 10.58DD134 pKa = 5.25VEE136 pKa = 4.24AHH138 pKa = 5.97EE139 pKa = 4.68QGQGDD144 pKa = 3.76IPTFYY149 pKa = 9.69TYY151 pKa = 10.91EE152 pKa = 4.64GGLSHH157 pKa = 7.05LTAEE161 pKa = 4.71GQATLEE167 pKa = 4.16RR168 pKa = 11.84LEE170 pKa = 4.8GMLSQSVSSQYY181 pKa = 11.68NMAGVRR187 pKa = 11.84TEE189 pKa = 4.15DD190 pKa = 3.91SIRR193 pKa = 11.84DD194 pKa = 3.72YY195 pKa = 11.39EE196 pKa = 5.4DD197 pKa = 3.26GMEE200 pKa = 4.14VDD202 pKa = 3.82TTPTVAGQFEE212 pKa = 4.72DD213 pKa = 3.71TDD215 pKa = 3.5VDD217 pKa = 3.87HH218 pKa = 7.41
PP1 pKa = 5.79EE2 pKa = 4.36TKK4 pKa = 10.04TEE6 pKa = 3.76AVLNGKK12 pKa = 8.91GLGTGLLYY20 pKa = 9.53ITEE23 pKa = 4.7SCLSWLDD30 pKa = 3.49GSGLGFSLEE39 pKa = 4.09YY40 pKa = 9.04PTISLHH46 pKa = 6.43AVSRR50 pKa = 11.84DD51 pKa = 3.01LNAYY55 pKa = 8.49PRR57 pKa = 11.84EE58 pKa = 4.02HH59 pKa = 7.32LYY61 pKa = 11.69VMVNAKK67 pKa = 10.12FGQEE71 pKa = 4.03SKK73 pKa = 11.01EE74 pKa = 4.13SVAEE78 pKa = 4.02EE79 pKa = 4.62EE80 pKa = 4.52EE81 pKa = 5.18DD82 pKa = 3.96SDD84 pKa = 6.17DD85 pKa = 3.89DD86 pKa = 4.15VEE88 pKa = 5.15PIAEE92 pKa = 4.09FRR94 pKa = 11.84FVPSDD99 pKa = 3.36KK100 pKa = 10.88SALEE104 pKa = 3.9AMFTAMCEE112 pKa = 4.33CQALHH117 pKa = 7.39PDD119 pKa = 4.25PEE121 pKa = 6.21DD122 pKa = 4.16EE123 pKa = 6.53DD124 pKa = 5.1SDD126 pKa = 5.45DD127 pKa = 4.29YY128 pKa = 11.91DD129 pKa = 4.07GEE131 pKa = 4.35EE132 pKa = 4.51YY133 pKa = 10.58DD134 pKa = 5.25VEE136 pKa = 4.24AHH138 pKa = 5.97EE139 pKa = 4.68QGQGDD144 pKa = 3.76IPTFYY149 pKa = 9.69TYY151 pKa = 10.91EE152 pKa = 4.64GGLSHH157 pKa = 7.05LTAEE161 pKa = 4.71GQATLEE167 pKa = 4.16RR168 pKa = 11.84LEE170 pKa = 4.8GMLSQSVSSQYY181 pKa = 11.68NMAGVRR187 pKa = 11.84TEE189 pKa = 4.15DD190 pKa = 3.91SIRR193 pKa = 11.84DD194 pKa = 3.72YY195 pKa = 11.39EE196 pKa = 5.4DD197 pKa = 3.26GMEE200 pKa = 4.14VDD202 pKa = 3.82TTPTVAGQFEE212 pKa = 4.72DD213 pKa = 3.71TDD215 pKa = 3.5VDD217 pKa = 3.87HH218 pKa = 7.41
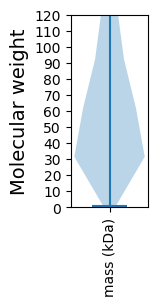
Molecular weight: 24.06 kDa
Isoelectric point according different methods:
Protein with the highest isoelectric point:
>tr|A0A5F4C3Z1|A0A5F4C3Z1_CANLF Dual-specificity kinase OS=Canis lupus familiaris OX=9615 GN=DYRK3 PE=3 SV=1
MM1 pKa = 7.1RR2 pKa = 11.84AKK4 pKa = 9.12WRR6 pKa = 11.84KK7 pKa = 9.1KK8 pKa = 9.32RR9 pKa = 11.84MRR11 pKa = 11.84RR12 pKa = 11.84LKK14 pKa = 10.08RR15 pKa = 11.84KK16 pKa = 8.21RR17 pKa = 11.84RR18 pKa = 11.84KK19 pKa = 8.46MRR21 pKa = 11.84QRR23 pKa = 11.84SKK25 pKa = 11.41
MM1 pKa = 7.1RR2 pKa = 11.84AKK4 pKa = 9.12WRR6 pKa = 11.84KK7 pKa = 9.1KK8 pKa = 9.32RR9 pKa = 11.84MRR11 pKa = 11.84RR12 pKa = 11.84LKK14 pKa = 10.08RR15 pKa = 11.84KK16 pKa = 8.21RR17 pKa = 11.84RR18 pKa = 11.84KK19 pKa = 8.46MRR21 pKa = 11.84QRR23 pKa = 11.84SKK25 pKa = 11.41
Molecular weight: 3.46 kDa
Isoelectric point according different methods:
Peptides (in silico digests for buttom-up proteomics)
Below you can find in silico digests of the whole proteome with Trypsin, Chymotrypsin, Trypsin+LysC, LysN, ArgC proteases suitable for different mass spec machines.| Try ESI |
 |
|---|
| ChTry ESI |
|
|---|
| ArgC ESI |
|
|---|
| LysN ESI |
|
|---|
| TryLysC ESI |
|
|---|
| Try MALDI |
|
|---|
| ChTry MALDI |
|
|---|
| ArgC MALDI |
|
|---|
| LysN MALDI |
|
|---|
| TryLysC MALDI |
|
|---|
| Try LTQ |
|
|---|
| ChTry LTQ |
|
|---|
| ArgC LTQ |
|
|---|
| LysN LTQ |
|
|---|
| TryLysC LTQ |
|
|---|
| Try MSlow |
|
|---|
| ChTry MSlow |
|
|---|
| ArgC MSlow |
|
|---|
| LysN MSlow |
|
|---|
| TryLysC MSlow |
|
|---|
| Try MShigh |
|
|---|
| ChTry MShigh |
|
|---|
| ArgC MShigh |
|
|---|
| LysN MShigh |
|
|---|
| TryLysC MShigh |
|
|---|
General Statistics
Number of major isoforms |
Number of additional isoforms |
Number of all proteins |
Number of amino acids |
Min. Seq. Length |
Max. Seq. Length |
Avg. Seq. Length |
Avg. Mol. Weight |
|---|---|---|---|---|---|---|---|
29901829 |
10 |
27097 |
658.6 |
73.38 |
Amino acid frequency
Ala |
Cys |
Asp |
Glu |
Phe |
Gly |
His |
Ile |
Lys |
Leu |
|---|---|---|---|---|---|---|---|---|---|
6.951 ± 0.014 | 2.176 ± 0.009 |
4.82 ± 0.008 | 7.161 ± 0.015 |
3.555 ± 0.008 | 6.546 ± 0.017 |
2.56 ± 0.005 | 4.447 ± 0.011 |
5.838 ± 0.014 | 9.853 ± 0.017 |
Met |
Asn |
Gln |
Pro |
Arg |
Ser |
Thr |
Val |
Trp |
Tyr |
|---|---|---|---|---|---|---|---|---|---|
2.126 ± 0.004 | 3.653 ± 0.009 |
6.35 ± 0.021 | 4.796 ± 0.011 |
5.761 ± 0.012 | 8.346 ± 0.015 |
5.293 ± 0.009 | 5.926 ± 0.01 |
1.215 ± 0.004 | 2.601 ± 0.007 |
Most of the basic statistics you can see at this page can be downloaded from this CSV file
See this proteome in:

Proteome-pI is available under Creative Commons Attribution-NoDerivs license, for more details see here
| Reference: Kozlowski LP. Proteome-pI 2.0: Proteome Isoelectric Point Database Update. Nucleic Acids Res. 2021, doi: 10.1093/nar/gkab944 | Contact: Lukasz P. Kozlowski |