Herbihabitans rhizosphaerae
Taxonomy: cellular organisms; Bacteria; Terrabacteria group; Actinobacteria; Actinomycetia; Pseudonocardiales; Pseudonocardiaceae; Herbihabitans
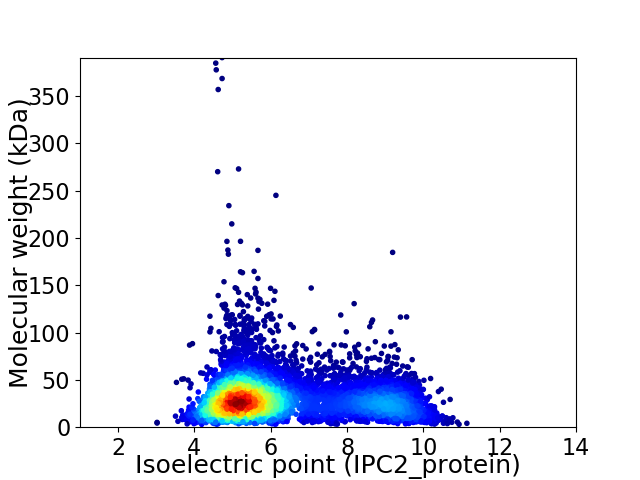
Average proteome isoelectric point is 6.3
Get precalculated fractions of proteins

Virtual 2D-PAGE plot for 6595 proteins (isoelectric point calculated using IPC2_protein)
Get csv file with sequences according to given criteria:
* You can choose from 21 different methods for calculating isoelectric point
Summary statistics related to proteome-wise predictions


Protein with the lowest isoelectric point:
>tr|A0A4Q7KII4|A0A4Q7KII4_9PSEU Methyltransferase family protein OS=Herbihabitans rhizosphaerae OX=1872711 GN=EV193_10886 PE=4 SV=1
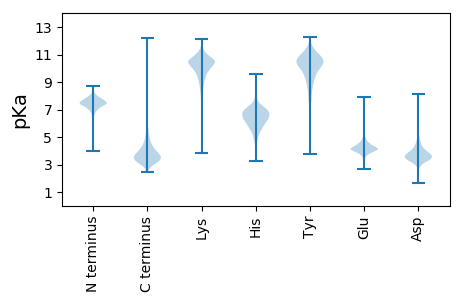
MM1 pKa = 7.37SVTPATEE8 pKa = 4.15PAPQGTPCWLEE19 pKa = 3.93LGTTNLPACTDD30 pKa = 4.3FYY32 pKa = 11.61AGLLGWEE39 pKa = 4.18YY40 pKa = 11.16QPDD43 pKa = 3.55DD44 pKa = 3.8SGYY47 pKa = 8.85LTAHH51 pKa = 6.7TDD53 pKa = 3.69GVPAAGLYY61 pKa = 9.69AFPDD65 pKa = 4.65GPPLPTTWTLYY76 pKa = 10.6LSVNNVANTAQRR88 pKa = 11.84VTMLDD93 pKa = 3.17GQVAVEE99 pKa = 3.92PRR101 pKa = 11.84EE102 pKa = 3.87IPGQGRR108 pKa = 11.84LMIAADD114 pKa = 3.64PTGALIGFWEE124 pKa = 4.94PATMWPFAQGGAGAFAWADD143 pKa = 3.36LHH145 pKa = 5.55TTDD148 pKa = 5.58GKK150 pKa = 10.98LADD153 pKa = 4.12EE154 pKa = 4.88FFVSLFSFDD163 pKa = 3.66TEE165 pKa = 4.38QVGDD169 pKa = 4.53GIDD172 pKa = 3.4YY173 pKa = 10.33DD174 pKa = 4.07YY175 pKa = 11.15TIWTLDD181 pKa = 3.45GPSLLGRR188 pKa = 11.84LRR190 pKa = 11.84MGAEE194 pKa = 4.57FEE196 pKa = 4.88PGTPPHH202 pKa = 6.07WMNYY206 pKa = 8.23VGVSAALGVDD216 pKa = 4.23LAATRR221 pKa = 11.84AIQLGGRR228 pKa = 11.84LHH230 pKa = 7.2AEE232 pKa = 4.43PFDD235 pKa = 3.84SPYY238 pKa = 11.1GRR240 pKa = 11.84IAVIEE245 pKa = 4.15DD246 pKa = 3.25VAGGVLSLVDD256 pKa = 3.33TSRR259 pKa = 11.84RR260 pKa = 11.84TPIAEE265 pKa = 3.99EE266 pKa = 4.91DD267 pKa = 3.3IGTAAVDD274 pKa = 4.64DD275 pKa = 5.3PYY277 pKa = 11.99DD278 pKa = 3.77DD279 pKa = 3.85
MM1 pKa = 7.37SVTPATEE8 pKa = 4.15PAPQGTPCWLEE19 pKa = 3.93LGTTNLPACTDD30 pKa = 4.3FYY32 pKa = 11.61AGLLGWEE39 pKa = 4.18YY40 pKa = 11.16QPDD43 pKa = 3.55DD44 pKa = 3.8SGYY47 pKa = 8.85LTAHH51 pKa = 6.7TDD53 pKa = 3.69GVPAAGLYY61 pKa = 9.69AFPDD65 pKa = 4.65GPPLPTTWTLYY76 pKa = 10.6LSVNNVANTAQRR88 pKa = 11.84VTMLDD93 pKa = 3.17GQVAVEE99 pKa = 3.92PRR101 pKa = 11.84EE102 pKa = 3.87IPGQGRR108 pKa = 11.84LMIAADD114 pKa = 3.64PTGALIGFWEE124 pKa = 4.94PATMWPFAQGGAGAFAWADD143 pKa = 3.36LHH145 pKa = 5.55TTDD148 pKa = 5.58GKK150 pKa = 10.98LADD153 pKa = 4.12EE154 pKa = 4.88FFVSLFSFDD163 pKa = 3.66TEE165 pKa = 4.38QVGDD169 pKa = 4.53GIDD172 pKa = 3.4YY173 pKa = 10.33DD174 pKa = 4.07YY175 pKa = 11.15TIWTLDD181 pKa = 3.45GPSLLGRR188 pKa = 11.84LRR190 pKa = 11.84MGAEE194 pKa = 4.57FEE196 pKa = 4.88PGTPPHH202 pKa = 6.07WMNYY206 pKa = 8.23VGVSAALGVDD216 pKa = 4.23LAATRR221 pKa = 11.84AIQLGGRR228 pKa = 11.84LHH230 pKa = 7.2AEE232 pKa = 4.43PFDD235 pKa = 3.84SPYY238 pKa = 11.1GRR240 pKa = 11.84IAVIEE245 pKa = 4.15DD246 pKa = 3.25VAGGVLSLVDD256 pKa = 3.33TSRR259 pKa = 11.84RR260 pKa = 11.84TPIAEE265 pKa = 3.99EE266 pKa = 4.91DD267 pKa = 3.3IGTAAVDD274 pKa = 4.64DD275 pKa = 5.3PYY277 pKa = 11.99DD278 pKa = 3.77DD279 pKa = 3.85
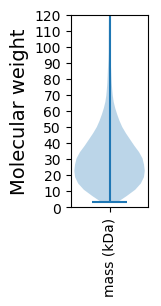
Molecular weight: 29.76 kDa
Isoelectric point according different methods:
Protein with the highest isoelectric point:
>tr|A0A4Q7L7P8|A0A4Q7L7P8_9PSEU 4-hydroxy-3-methylbut-2-enyl diphosphate reductase OS=Herbihabitans rhizosphaerae OX=1872711 GN=ispH PE=3 SV=1
MM1 pKa = 7.4GSVIKK6 pKa = 10.38KK7 pKa = 8.42RR8 pKa = 11.84RR9 pKa = 11.84KK10 pKa = 9.06RR11 pKa = 11.84MSKK14 pKa = 9.76KK15 pKa = 9.54KK16 pKa = 9.79HH17 pKa = 5.67RR18 pKa = 11.84KK19 pKa = 8.46LLRR22 pKa = 11.84KK23 pKa = 7.95TRR25 pKa = 11.84VQRR28 pKa = 11.84RR29 pKa = 11.84KK30 pKa = 10.07LGKK33 pKa = 9.87
MM1 pKa = 7.4GSVIKK6 pKa = 10.38KK7 pKa = 8.42RR8 pKa = 11.84RR9 pKa = 11.84KK10 pKa = 9.06RR11 pKa = 11.84MSKK14 pKa = 9.76KK15 pKa = 9.54KK16 pKa = 9.79HH17 pKa = 5.67RR18 pKa = 11.84KK19 pKa = 8.46LLRR22 pKa = 11.84KK23 pKa = 7.95TRR25 pKa = 11.84VQRR28 pKa = 11.84RR29 pKa = 11.84KK30 pKa = 10.07LGKK33 pKa = 9.87
Molecular weight: 4.12 kDa
Isoelectric point according different methods:
Peptides (in silico digests for buttom-up proteomics)
Below you can find in silico digests of the whole proteome with Trypsin, Chymotrypsin, Trypsin+LysC, LysN, ArgC proteases suitable for different mass spec machines.| Try ESI |
 |
|---|
| ChTry ESI |
 |
|---|
| ArgC ESI |
 |
|---|
| LysN ESI |
 |
|---|
| TryLysC ESI |
 |
|---|
| Try MALDI |
 |
|---|
| ChTry MALDI |
 |
|---|
| ArgC MALDI |
 |
|---|
| LysN MALDI |
 |
|---|
| TryLysC MALDI |
 |
|---|
| Try LTQ |
 |
|---|
| ChTry LTQ |
 |
|---|
| ArgC LTQ |
 |
|---|
| LysN LTQ |
 |
|---|
| TryLysC LTQ |
 |
|---|
| Try MSlow |
 |
|---|
| ChTry MSlow |
 |
|---|
| ArgC MSlow |
 |
|---|
| LysN MSlow |
 |
|---|
| TryLysC MSlow |
 |
|---|
| Try MShigh |
 |
|---|
| ChTry MShigh |
 |
|---|
| ArgC MShigh |
 |
|---|
| LysN MShigh |
 |
|---|
| TryLysC MShigh |
 |
|---|
General Statistics
Number of major isoforms |
Number of additional isoforms |
Number of all proteins |
Number of amino acids |
Min. Seq. Length |
Max. Seq. Length |
Avg. Seq. Length |
Avg. Mol. Weight |
|---|---|---|---|---|---|---|---|
0 |
2000804 |
29 |
3672 |
303.4 |
32.59 |
Amino acid frequency
Ala |
Cys |
Asp |
Glu |
Phe |
Gly |
His |
Ile |
Lys |
Leu |
|---|---|---|---|---|---|---|---|---|---|
12.841 ± 0.041 | 0.797 ± 0.009 |
6.29 ± 0.024 | 5.592 ± 0.03 |
2.808 ± 0.018 | 9.131 ± 0.031 |
2.219 ± 0.014 | 3.726 ± 0.02 |
2.347 ± 0.027 | 9.999 ± 0.042 |
Met |
Asn |
Gln |
Pro |
Arg |
Ser |
Thr |
Val |
Trp |
Tyr |
|---|---|---|---|---|---|---|---|---|---|
1.853 ± 0.011 | 2.049 ± 0.019 |
5.893 ± 0.027 | 2.7 ± 0.019 |
7.872 ± 0.035 | 5.202 ± 0.023 |
6.19 ± 0.023 | 8.959 ± 0.03 |
1.537 ± 0.014 | 1.995 ± 0.016 |
Most of the basic statistics you can see at this page can be downloaded from this CSV file
Proteome-pI is available under Creative Commons Attribution-NoDerivs license, for more details see here
| Reference: Kozlowski LP. Proteome-pI 2.0: Proteome Isoelectric Point Database Update. Nucleic Acids Res. 2021, doi: 10.1093/nar/gkab944 | Contact: Lukasz P. Kozlowski |
