Agromyces protaetiae
Taxonomy: cellular organisms; Bacteria; Terrabacteria group; Actinobacteria; Actinomycetia; Micrococcales; Microbacteriaceae; Agromyces
Average proteome isoelectric point is 5.96
Get precalculated fractions of proteins

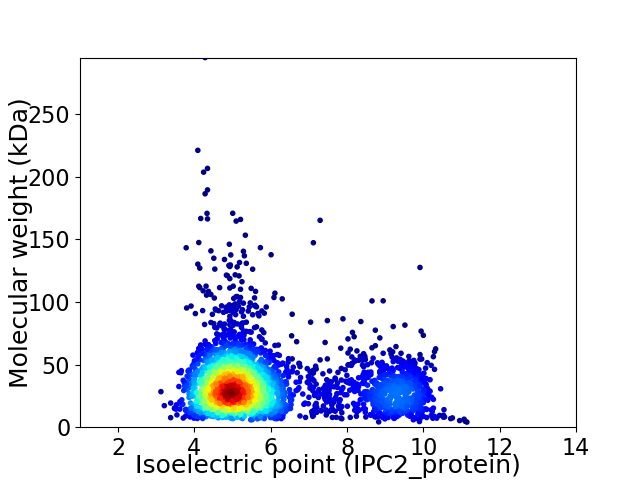
Virtual 2D-PAGE plot for 3136 proteins (isoelectric point calculated using IPC2_protein)
Get csv file with sequences according to given criteria:
* You can choose from 21 different methods for calculating isoelectric point
Summary statistics related to proteome-wise predictions


Protein with the lowest isoelectric point:
>tr|A0A4P6FAI9|A0A4P6FAI9_9MICO ATP-binding cassette domain-containing protein OS=Agromyces protaetiae OX=2509455 GN=ET445_06055 PE=4 SV=1
MM1 pKa = 7.44HH2 pKa = 7.05SSIVRR7 pKa = 11.84GAAALAGLTLAFGLAACSTPSSAEE31 pKa = 3.78DD32 pKa = 3.36TASDD36 pKa = 3.51DD37 pKa = 3.66TAAGTFASGDD47 pKa = 3.58EE48 pKa = 4.16NTLVFATLPDD58 pKa = 3.86HH59 pKa = 7.17EE60 pKa = 5.57GADD63 pKa = 3.83QDD65 pKa = 4.16AQPIADD71 pKa = 4.86WIAAITGKK79 pKa = 10.28DD80 pKa = 3.39VEE82 pKa = 4.6FFEE85 pKa = 4.63ATDD88 pKa = 3.57YY89 pKa = 10.19TAVVQGLAAGQIDD102 pKa = 3.74IAQISAFTYY111 pKa = 9.98YY112 pKa = 10.04QAQNAGADD120 pKa = 3.51IVPIGAQITSEE131 pKa = 4.06GAEE134 pKa = 3.7PGYY137 pKa = 11.03YY138 pKa = 9.82SVALKK143 pKa = 10.85NPAATDD149 pKa = 3.59VTSLADD155 pKa = 3.58FADD158 pKa = 4.1RR159 pKa = 11.84PVCFVNPTSTSGRR172 pKa = 11.84AIPAGQLKK180 pKa = 10.34SAGVTVSEE188 pKa = 4.42EE189 pKa = 3.76NTVFGEE195 pKa = 4.14EE196 pKa = 4.19HH197 pKa = 7.45DD198 pKa = 3.96LTAAKK203 pKa = 9.88IAEE206 pKa = 4.42GVDD209 pKa = 3.7CQVGFAQDD217 pKa = 3.03VDD219 pKa = 4.01ADD221 pKa = 4.0PLIEE225 pKa = 4.79SGALEE230 pKa = 4.66EE231 pKa = 4.15IDD233 pKa = 4.51RR234 pKa = 11.84YY235 pKa = 10.31LVPAAPIVMQAGLPQALQDD254 pKa = 3.81QLIEE258 pKa = 4.86AIADD262 pKa = 3.69STQSSLTDD270 pKa = 3.23AGVEE274 pKa = 3.95LNEE277 pKa = 4.44FLTEE281 pKa = 3.54NWFGFGKK288 pKa = 10.43VDD290 pKa = 4.22DD291 pKa = 4.74SYY293 pKa = 11.57YY294 pKa = 11.18DD295 pKa = 3.64NIRR298 pKa = 11.84TVCDD302 pKa = 3.34EE303 pKa = 3.88VADD306 pKa = 3.89IVEE309 pKa = 4.28ACAAA313 pKa = 3.97
MM1 pKa = 7.44HH2 pKa = 7.05SSIVRR7 pKa = 11.84GAAALAGLTLAFGLAACSTPSSAEE31 pKa = 3.78DD32 pKa = 3.36TASDD36 pKa = 3.51DD37 pKa = 3.66TAAGTFASGDD47 pKa = 3.58EE48 pKa = 4.16NTLVFATLPDD58 pKa = 3.86HH59 pKa = 7.17EE60 pKa = 5.57GADD63 pKa = 3.83QDD65 pKa = 4.16AQPIADD71 pKa = 4.86WIAAITGKK79 pKa = 10.28DD80 pKa = 3.39VEE82 pKa = 4.6FFEE85 pKa = 4.63ATDD88 pKa = 3.57YY89 pKa = 10.19TAVVQGLAAGQIDD102 pKa = 3.74IAQISAFTYY111 pKa = 9.98YY112 pKa = 10.04QAQNAGADD120 pKa = 3.51IVPIGAQITSEE131 pKa = 4.06GAEE134 pKa = 3.7PGYY137 pKa = 11.03YY138 pKa = 9.82SVALKK143 pKa = 10.85NPAATDD149 pKa = 3.59VTSLADD155 pKa = 3.58FADD158 pKa = 4.1RR159 pKa = 11.84PVCFVNPTSTSGRR172 pKa = 11.84AIPAGQLKK180 pKa = 10.34SAGVTVSEE188 pKa = 4.42EE189 pKa = 3.76NTVFGEE195 pKa = 4.14EE196 pKa = 4.19HH197 pKa = 7.45DD198 pKa = 3.96LTAAKK203 pKa = 9.88IAEE206 pKa = 4.42GVDD209 pKa = 3.7CQVGFAQDD217 pKa = 3.03VDD219 pKa = 4.01ADD221 pKa = 4.0PLIEE225 pKa = 4.79SGALEE230 pKa = 4.66EE231 pKa = 4.15IDD233 pKa = 4.51RR234 pKa = 11.84YY235 pKa = 10.31LVPAAPIVMQAGLPQALQDD254 pKa = 3.81QLIEE258 pKa = 4.86AIADD262 pKa = 3.69STQSSLTDD270 pKa = 3.23AGVEE274 pKa = 3.95LNEE277 pKa = 4.44FLTEE281 pKa = 3.54NWFGFGKK288 pKa = 10.43VDD290 pKa = 4.22DD291 pKa = 4.74SYY293 pKa = 11.57YY294 pKa = 11.18DD295 pKa = 3.64NIRR298 pKa = 11.84TVCDD302 pKa = 3.34EE303 pKa = 3.88VADD306 pKa = 3.89IVEE309 pKa = 4.28ACAAA313 pKa = 3.97
Molecular weight: 32.46 kDa
Isoelectric point according different methods:
Protein with the highest isoelectric point:
>tr|A0A4P6F9C9|A0A4P6F9C9_9MICO Transcriptional regulator OS=Agromyces protaetiae OX=2509455 GN=ET445_04805 PE=4 SV=1
MM1 pKa = 7.4GSVIKK6 pKa = 10.42KK7 pKa = 8.47RR8 pKa = 11.84RR9 pKa = 11.84KK10 pKa = 9.22RR11 pKa = 11.84MAKK14 pKa = 9.41KK15 pKa = 9.87KK16 pKa = 9.7HH17 pKa = 5.84RR18 pKa = 11.84KK19 pKa = 8.56LLRR22 pKa = 11.84KK23 pKa = 7.78TRR25 pKa = 11.84HH26 pKa = 3.65QRR28 pKa = 11.84RR29 pKa = 11.84NKK31 pKa = 9.78KK32 pKa = 9.85
MM1 pKa = 7.4GSVIKK6 pKa = 10.42KK7 pKa = 8.47RR8 pKa = 11.84RR9 pKa = 11.84KK10 pKa = 9.22RR11 pKa = 11.84MAKK14 pKa = 9.41KK15 pKa = 9.87KK16 pKa = 9.7HH17 pKa = 5.84RR18 pKa = 11.84KK19 pKa = 8.56LLRR22 pKa = 11.84KK23 pKa = 7.78TRR25 pKa = 11.84HH26 pKa = 3.65QRR28 pKa = 11.84RR29 pKa = 11.84NKK31 pKa = 9.78KK32 pKa = 9.85
Molecular weight: 4.08 kDa
Isoelectric point according different methods:
Peptides (in silico digests for buttom-up proteomics)
Below you can find in silico digests of the whole proteome with Trypsin, Chymotrypsin, Trypsin+LysC, LysN, ArgC proteases suitable for different mass spec machines.| Try ESI |
 |
|---|
| ChTry ESI |
 |
|---|
| ArgC ESI |
 |
|---|
| LysN ESI |
 |
|---|
| TryLysC ESI |
 |
|---|
| Try MALDI |
 |
|---|
| ChTry MALDI |
 |
|---|
| ArgC MALDI |
 |
|---|
| LysN MALDI |
 |
|---|
| TryLysC MALDI |
 |
|---|
| Try LTQ |
 |
|---|
| ChTry LTQ |
 |
|---|
| ArgC LTQ |
 |
|---|
| LysN LTQ |
 |
|---|
| TryLysC LTQ |
 |
|---|
| Try MSlow |
 |
|---|
| ChTry MSlow |
 |
|---|
| ArgC MSlow |
 |
|---|
| LysN MSlow |
 |
|---|
| TryLysC MSlow |
 |
|---|
| Try MShigh |
 |
|---|
| ChTry MShigh |
 |
|---|
| ArgC MShigh |
 |
|---|
| LysN MShigh |
 |
|---|
| TryLysC MShigh |
 |
|---|
General Statistics
Number of major isoforms |
Number of additional isoforms |
Number of all proteins |
Number of amino acids |
Min. Seq. Length |
Max. Seq. Length |
Avg. Seq. Length |
Avg. Mol. Weight |
|---|---|---|---|---|---|---|---|
0 |
1040253 |
32 |
2823 |
331.7 |
35.36 |
Amino acid frequency
Ala |
Cys |
Asp |
Glu |
Phe |
Gly |
His |
Ile |
Lys |
Leu |
|---|---|---|---|---|---|---|---|---|---|
14.191 ± 0.07 | 0.465 ± 0.01 |
6.311 ± 0.038 | 5.841 ± 0.039 |
3.209 ± 0.03 | 9.124 ± 0.033 |
1.896 ± 0.019 | 4.308 ± 0.03 |
1.945 ± 0.033 | 9.987 ± 0.046 |
Met |
Asn |
Gln |
Pro |
Arg |
Ser |
Thr |
Val |
Trp |
Tyr |
|---|---|---|---|---|---|---|---|---|---|
1.501 ± 0.018 | 1.817 ± 0.028 |
5.54 ± 0.033 | 2.52 ± 0.022 |
7.492 ± 0.052 | 5.546 ± 0.03 |
5.74 ± 0.04 | 9.167 ± 0.046 |
1.516 ± 0.018 | 1.885 ± 0.019 |
Most of the basic statistics you can see at this page can be downloaded from this CSV file
Proteome-pI is available under Creative Commons Attribution-NoDerivs license, for more details see here
| Reference: Kozlowski LP. Proteome-pI 2.0: Proteome Isoelectric Point Database Update. Nucleic Acids Res. 2021, doi: 10.1093/nar/gkab944 | Contact: Lukasz P. Kozlowski |
