Cobetia sp. UCD-24C
Taxonomy: cellular organisms; Bacteria; Proteobacteria; Gammaproteobacteria; Oceanospirillales; Halomonadaceae; Cobetia; unclassified Cobetia
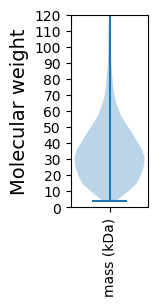
Average proteome isoelectric point is 6.0
Get precalculated fractions of proteins

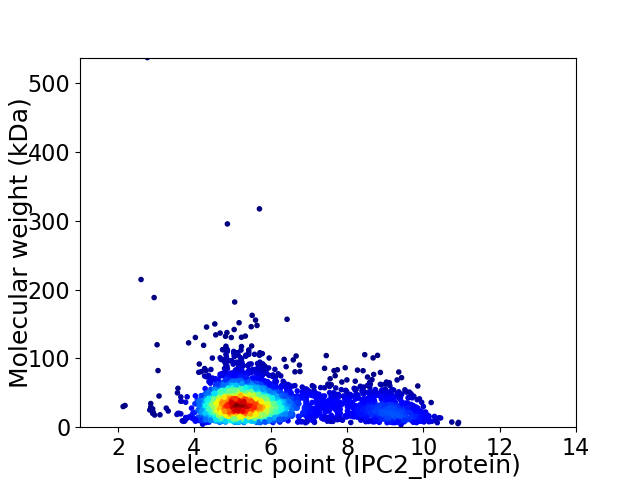
Virtual 2D-PAGE plot for 3112 proteins (isoelectric point calculated using IPC2_protein)
Get csv file with sequences according to given criteria:
* You can choose from 21 different methods for calculating isoelectric point
Summary statistics related to proteome-wise predictions


Protein with the lowest isoelectric point:
>tr|A0A0P7DHW8|A0A0P7DHW8_9GAMM Diaminobutyrate--2-oxoglutarate transaminase OS=Cobetia sp. UCD-24C OX=1716176 GN=AOG28_12575 PE=3 SV=1
MM1 pKa = 7.72AFSQALSGLSAASTNLDD18 pKa = 3.46VIGNNIANSEE28 pKa = 4.4TVGFKK33 pKa = 10.57SSEE36 pKa = 3.91AQFSDD41 pKa = 3.69IYY43 pKa = 11.07AGSQAAGIGVQLASVAQDD61 pKa = 3.5FTSGSLEE68 pKa = 3.99STGRR72 pKa = 11.84DD73 pKa = 2.94LDD75 pKa = 4.06LAISGDD81 pKa = 3.37GFLRR85 pKa = 11.84FSDD88 pKa = 3.37TSGQIVYY95 pKa = 10.52SRR97 pKa = 11.84NGQLNIDD104 pKa = 3.65AEE106 pKa = 4.95GYY108 pKa = 9.99IVTAQGAQLTGYY120 pKa = 9.65SGEE123 pKa = 4.34GVTGEE128 pKa = 4.2PVVLQIPTAPLAAKK142 pKa = 8.27ATQDD146 pKa = 3.66NIALEE151 pKa = 4.49VYY153 pKa = 9.88GAEE156 pKa = 4.12VALNLDD162 pKa = 3.72AADD165 pKa = 4.64LVPATADD172 pKa = 3.75FDD174 pKa = 4.1PTDD177 pKa = 3.46AATYY181 pKa = 9.89NYY183 pKa = 9.66ASAMTVYY190 pKa = 10.86DD191 pKa = 3.75SLGDD195 pKa = 3.63EE196 pKa = 4.33HH197 pKa = 8.38VVTSFYY203 pKa = 11.45AKK205 pKa = 9.85TEE207 pKa = 4.04NNTWNVHH214 pKa = 4.43HH215 pKa = 7.18VMDD218 pKa = 5.44FSSKK222 pKa = 10.1AAEE225 pKa = 3.95LQEE228 pKa = 4.44QIDD231 pKa = 4.26EE232 pKa = 4.56GVADD236 pKa = 4.41PSVDD240 pKa = 4.02FDD242 pKa = 4.05PQTEE246 pKa = 4.53VITFGAGGQLLDD258 pKa = 4.12YY259 pKa = 10.56SQTAQTYY266 pKa = 9.56ALANGASDD274 pKa = 4.11LSFSIDD280 pKa = 3.73FTGSTQYY287 pKa = 11.87ANDD290 pKa = 3.74FEE292 pKa = 5.78VITLSQNGYY301 pKa = 7.98TSGSLVGVSFEE312 pKa = 3.87EE313 pKa = 4.36DD314 pKa = 3.04GRR316 pKa = 11.84VIGSYY321 pKa = 10.9SNEE324 pKa = 3.83LKK326 pKa = 9.1QTLGTIALANFANEE340 pKa = 4.74QGLQPNGDD348 pKa = 4.05NGWVATASSGVPLVGVPGEE367 pKa = 4.32GVFGEE372 pKa = 4.45VQSGVVEE379 pKa = 4.24ASNVDD384 pKa = 3.76LTTEE388 pKa = 3.95LVDD391 pKa = 6.24LIIAQRR397 pKa = 11.84NYY399 pKa = 10.3QSNAQTIKK407 pKa = 10.92VQDD410 pKa = 3.75EE411 pKa = 4.47VQQSVINMRR420 pKa = 3.65
MM1 pKa = 7.72AFSQALSGLSAASTNLDD18 pKa = 3.46VIGNNIANSEE28 pKa = 4.4TVGFKK33 pKa = 10.57SSEE36 pKa = 3.91AQFSDD41 pKa = 3.69IYY43 pKa = 11.07AGSQAAGIGVQLASVAQDD61 pKa = 3.5FTSGSLEE68 pKa = 3.99STGRR72 pKa = 11.84DD73 pKa = 2.94LDD75 pKa = 4.06LAISGDD81 pKa = 3.37GFLRR85 pKa = 11.84FSDD88 pKa = 3.37TSGQIVYY95 pKa = 10.52SRR97 pKa = 11.84NGQLNIDD104 pKa = 3.65AEE106 pKa = 4.95GYY108 pKa = 9.99IVTAQGAQLTGYY120 pKa = 9.65SGEE123 pKa = 4.34GVTGEE128 pKa = 4.2PVVLQIPTAPLAAKK142 pKa = 8.27ATQDD146 pKa = 3.66NIALEE151 pKa = 4.49VYY153 pKa = 9.88GAEE156 pKa = 4.12VALNLDD162 pKa = 3.72AADD165 pKa = 4.64LVPATADD172 pKa = 3.75FDD174 pKa = 4.1PTDD177 pKa = 3.46AATYY181 pKa = 9.89NYY183 pKa = 9.66ASAMTVYY190 pKa = 10.86DD191 pKa = 3.75SLGDD195 pKa = 3.63EE196 pKa = 4.33HH197 pKa = 8.38VVTSFYY203 pKa = 11.45AKK205 pKa = 9.85TEE207 pKa = 4.04NNTWNVHH214 pKa = 4.43HH215 pKa = 7.18VMDD218 pKa = 5.44FSSKK222 pKa = 10.1AAEE225 pKa = 3.95LQEE228 pKa = 4.44QIDD231 pKa = 4.26EE232 pKa = 4.56GVADD236 pKa = 4.41PSVDD240 pKa = 4.02FDD242 pKa = 4.05PQTEE246 pKa = 4.53VITFGAGGQLLDD258 pKa = 4.12YY259 pKa = 10.56SQTAQTYY266 pKa = 9.56ALANGASDD274 pKa = 4.11LSFSIDD280 pKa = 3.73FTGSTQYY287 pKa = 11.87ANDD290 pKa = 3.74FEE292 pKa = 5.78VITLSQNGYY301 pKa = 7.98TSGSLVGVSFEE312 pKa = 3.87EE313 pKa = 4.36DD314 pKa = 3.04GRR316 pKa = 11.84VIGSYY321 pKa = 10.9SNEE324 pKa = 3.83LKK326 pKa = 9.1QTLGTIALANFANEE340 pKa = 4.74QGLQPNGDD348 pKa = 4.05NGWVATASSGVPLVGVPGEE367 pKa = 4.32GVFGEE372 pKa = 4.45VQSGVVEE379 pKa = 4.24ASNVDD384 pKa = 3.76LTTEE388 pKa = 3.95LVDD391 pKa = 6.24LIIAQRR397 pKa = 11.84NYY399 pKa = 10.3QSNAQTIKK407 pKa = 10.92VQDD410 pKa = 3.75EE411 pKa = 4.47VQQSVINMRR420 pKa = 3.65
Molecular weight: 43.97 kDa
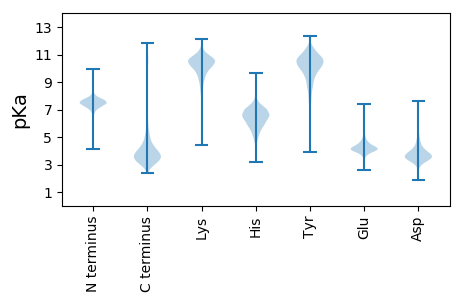
Isoelectric point according different methods:
Protein with the highest isoelectric point:
>tr|A0A0P7DGN0|A0A0P7DGN0_9GAMM MFS sugar transporter OS=Cobetia sp. UCD-24C OX=1716176 GN=AOG28_16360 PE=4 SV=1
MM1 pKa = 7.67RR2 pKa = 11.84FANPRR7 pKa = 11.84MSLPGSTLTIILMALTLQAGTRR29 pKa = 11.84MAIHH33 pKa = 6.95TATHH37 pKa = 5.8MNIHH41 pKa = 5.08TAIRR45 pKa = 11.84TATHH49 pKa = 6.45MIIHH53 pKa = 7.23TGTTMITRR61 pKa = 11.84LRR63 pKa = 3.79
MM1 pKa = 7.67RR2 pKa = 11.84FANPRR7 pKa = 11.84MSLPGSTLTIILMALTLQAGTRR29 pKa = 11.84MAIHH33 pKa = 6.95TATHH37 pKa = 5.8MNIHH41 pKa = 5.08TAIRR45 pKa = 11.84TATHH49 pKa = 6.45MIIHH53 pKa = 7.23TGTTMITRR61 pKa = 11.84LRR63 pKa = 3.79
Molecular weight: 7.0 kDa
Isoelectric point according different methods:
Peptides (in silico digests for buttom-up proteomics)
Below you can find in silico digests of the whole proteome with Trypsin, Chymotrypsin, Trypsin+LysC, LysN, ArgC proteases suitable for different mass spec machines.| Try ESI |
 |
|---|
| ChTry ESI |
 |
|---|
| ArgC ESI |
 |
|---|
| LysN ESI |
 |
|---|
| TryLysC ESI |
 |
|---|
| Try MALDI |
 |
|---|
| ChTry MALDI |
 |
|---|
| ArgC MALDI |
 |
|---|
| LysN MALDI |
 |
|---|
| TryLysC MALDI |
 |
|---|
| Try LTQ |
 |
|---|
| ChTry LTQ |
 |
|---|
| ArgC LTQ |
 |
|---|
| LysN LTQ |
 |
|---|
| TryLysC LTQ |
 |
|---|
| Try MSlow |
 |
|---|
| ChTry MSlow |
 |
|---|
| ArgC MSlow |
 |
|---|
| LysN MSlow |
 |
|---|
| TryLysC MSlow |
 |
|---|
| Try MShigh |
 |
|---|
| ChTry MShigh |
 |
|---|
| ArgC MShigh |
 |
|---|
| LysN MShigh |
 |
|---|
| TryLysC MShigh |
 |
|---|
General Statistics
Number of major isoforms |
Number of additional isoforms |
Number of all proteins |
Number of amino acids |
Min. Seq. Length |
Max. Seq. Length |
Avg. Seq. Length |
Avg. Mol. Weight |
|---|---|---|---|---|---|---|---|
0 |
1036695 |
31 |
5310 |
333.1 |
36.38 |
Amino acid frequency
Ala |
Cys |
Asp |
Glu |
Phe |
Gly |
His |
Ile |
Lys |
Leu |
|---|---|---|---|---|---|---|---|---|---|
11.385 ± 0.062 | 0.982 ± 0.014 |
5.763 ± 0.06 | 6.303 ± 0.049 |
3.391 ± 0.027 | 8.184 ± 0.042 |
2.419 ± 0.024 | 4.815 ± 0.036 |
2.848 ± 0.041 | 11.389 ± 0.069 |
Met |
Asn |
Gln |
Pro |
Arg |
Ser |
Thr |
Val |
Trp |
Tyr |
|---|---|---|---|---|---|---|---|---|---|
2.664 ± 0.027 | 2.606 ± 0.028 |
4.72 ± 0.03 | 3.955 ± 0.029 |
6.616 ± 0.052 | 6.01 ± 0.037 |
5.14 ± 0.057 | 7.083 ± 0.04 |
1.437 ± 0.017 | 2.29 ± 0.023 |
Most of the basic statistics you can see at this page can be downloaded from this CSV file
Proteome-pI is available under Creative Commons Attribution-NoDerivs license, for more details see here
| Reference: Kozlowski LP. Proteome-pI 2.0: Proteome Isoelectric Point Database Update. Nucleic Acids Res. 2021, doi: 10.1093/nar/gkab944 | Contact: Lukasz P. Kozlowski |
