Pelobacter acetylenicus
Taxonomy: cellular organisms; Bacteria; Proteobacteria; delta/epsilon subdivisions; Deltaproteobacteria; Desulfuromonadales; Syntrophotaleaceae; Syntrophotalea
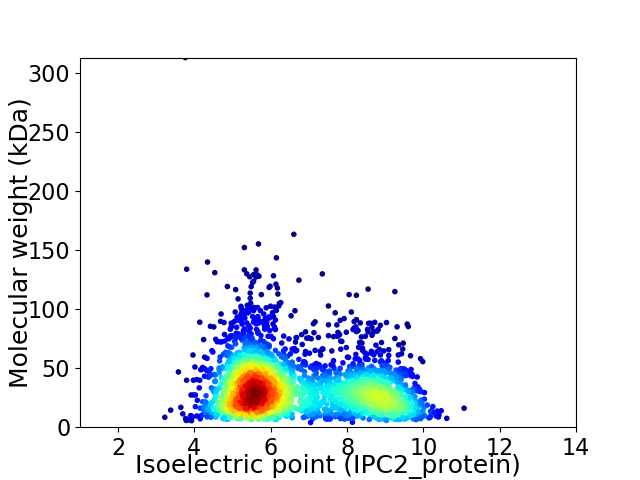
Average proteome isoelectric point is 6.68
Get precalculated fractions of proteins

Virtual 2D-PAGE plot for 2796 proteins (isoelectric point calculated using IPC2_protein)
Get csv file with sequences according to given criteria:
* You can choose from 21 different methods for calculating isoelectric point
Summary statistics related to proteome-wise predictions


Protein with the lowest isoelectric point:
>tr|A0A1L3GEX8|A0A1L3GEX8_PELAE RNA polymerase subunit sigma OS=Pelobacter acetylenicus OX=29542 GN=A7E75_05310 PE=4 SV=1
MM1 pKa = 7.37KK2 pKa = 9.77KK3 pKa = 9.7WSVLLVSVFMLAVGFASQAQAKK25 pKa = 9.84IEE27 pKa = 4.1VEE29 pKa = 3.81GDD31 pKa = 3.39VYY33 pKa = 11.44AGIWDD38 pKa = 3.67KK39 pKa = 11.75YY40 pKa = 6.29MWRR43 pKa = 11.84GFNLSDD49 pKa = 4.46SRR51 pKa = 11.84PTIQAGIDD59 pKa = 3.48LTLGSGWTLSTWHH72 pKa = 6.08NWQLTSGPNWNAGEE86 pKa = 4.12LNEE89 pKa = 4.23TDD91 pKa = 4.56VILTYY96 pKa = 11.11AFDD99 pKa = 4.65LGDD102 pKa = 4.57MISMSVGDD110 pKa = 3.83IWYY113 pKa = 8.69MIEE116 pKa = 5.12GEE118 pKa = 4.28DD119 pKa = 3.73TNEE122 pKa = 3.84LFVTFTLNTLLSPNLKK138 pKa = 9.72ISYY141 pKa = 9.61DD142 pKa = 3.24WDD144 pKa = 3.58RR145 pKa = 11.84AEE147 pKa = 4.51EE148 pKa = 4.64DD149 pKa = 3.63GLFYY153 pKa = 11.08SFDD156 pKa = 3.37ISHH159 pKa = 6.54TFDD162 pKa = 3.39LGQWVPNTALNLGALVSYY180 pKa = 9.58NQHH183 pKa = 6.5ADD185 pKa = 3.37GTVADD190 pKa = 3.8YY191 pKa = 11.27AGWHH195 pKa = 5.95NYY197 pKa = 7.78EE198 pKa = 4.27LSASIDD204 pKa = 3.59YY205 pKa = 10.98ALNDD209 pKa = 3.5QMTISPIFIFSSPISSAAKK228 pKa = 10.25DD229 pKa = 4.08LIDD232 pKa = 4.13TEE234 pKa = 4.31TAAALNLTFAFF245 pKa = 4.57
MM1 pKa = 7.37KK2 pKa = 9.77KK3 pKa = 9.7WSVLLVSVFMLAVGFASQAQAKK25 pKa = 9.84IEE27 pKa = 4.1VEE29 pKa = 3.81GDD31 pKa = 3.39VYY33 pKa = 11.44AGIWDD38 pKa = 3.67KK39 pKa = 11.75YY40 pKa = 6.29MWRR43 pKa = 11.84GFNLSDD49 pKa = 4.46SRR51 pKa = 11.84PTIQAGIDD59 pKa = 3.48LTLGSGWTLSTWHH72 pKa = 6.08NWQLTSGPNWNAGEE86 pKa = 4.12LNEE89 pKa = 4.23TDD91 pKa = 4.56VILTYY96 pKa = 11.11AFDD99 pKa = 4.65LGDD102 pKa = 4.57MISMSVGDD110 pKa = 3.83IWYY113 pKa = 8.69MIEE116 pKa = 5.12GEE118 pKa = 4.28DD119 pKa = 3.73TNEE122 pKa = 3.84LFVTFTLNTLLSPNLKK138 pKa = 9.72ISYY141 pKa = 9.61DD142 pKa = 3.24WDD144 pKa = 3.58RR145 pKa = 11.84AEE147 pKa = 4.51EE148 pKa = 4.64DD149 pKa = 3.63GLFYY153 pKa = 11.08SFDD156 pKa = 3.37ISHH159 pKa = 6.54TFDD162 pKa = 3.39LGQWVPNTALNLGALVSYY180 pKa = 9.58NQHH183 pKa = 6.5ADD185 pKa = 3.37GTVADD190 pKa = 3.8YY191 pKa = 11.27AGWHH195 pKa = 5.95NYY197 pKa = 7.78EE198 pKa = 4.27LSASIDD204 pKa = 3.59YY205 pKa = 10.98ALNDD209 pKa = 3.5QMTISPIFIFSSPISSAAKK228 pKa = 10.25DD229 pKa = 4.08LIDD232 pKa = 4.13TEE234 pKa = 4.31TAAALNLTFAFF245 pKa = 4.57
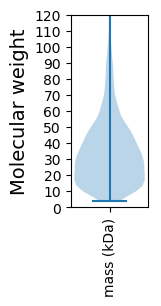
Molecular weight: 27.33 kDa
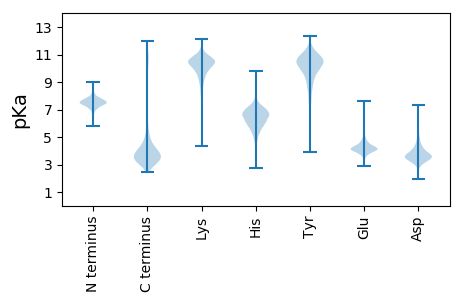
Isoelectric point according different methods:
Protein with the highest isoelectric point:
>tr|A0A1L3GCS0|A0A1L3GCS0_PELAE Uncharacterized protein OS=Pelobacter acetylenicus OX=29542 GN=A7E75_00875 PE=4 SV=1
MM1 pKa = 6.89TAVPVAVPVAVPVAVPAVVRR21 pKa = 11.84AAVPVVVPVVVPVAVPAVVRR41 pKa = 11.84AAVPVVVPVAVPVAVPVAVPVAVPAVVPAVVPAVVRR77 pKa = 11.84AVVRR81 pKa = 11.84AVVPAVVPAVVPAVVPAAVPVAVPVAVPVAVPVAVPAVVPAVVPVVVPVVVPVAVPVAVPAVVRR145 pKa = 11.84AAVRR149 pKa = 11.84AAVRR153 pKa = 11.84AAVRR157 pKa = 11.84VAVPVAVPVAVPVV170 pKa = 3.41
MM1 pKa = 6.89TAVPVAVPVAVPVAVPAVVRR21 pKa = 11.84AAVPVVVPVVVPVAVPAVVRR41 pKa = 11.84AAVPVVVPVAVPVAVPVAVPVAVPAVVPAVVPAVVRR77 pKa = 11.84AVVRR81 pKa = 11.84AVVPAVVPAVVPAVVPAAVPVAVPVAVPVAVPVAVPAVVPAVVPVVVPVVVPVAVPVAVPAVVRR145 pKa = 11.84AAVRR149 pKa = 11.84AAVRR153 pKa = 11.84AAVRR157 pKa = 11.84VAVPVAVPVAVPVV170 pKa = 3.41
Molecular weight: 16.09 kDa
Isoelectric point according different methods:
Peptides (in silico digests for buttom-up proteomics)
Below you can find in silico digests of the whole proteome with Trypsin, Chymotrypsin, Trypsin+LysC, LysN, ArgC proteases suitable for different mass spec machines.| Try ESI |
 |
|---|
| ChTry ESI |
 |
|---|
| ArgC ESI |
 |
|---|
| LysN ESI |
 |
|---|
| TryLysC ESI |
 |
|---|
| Try MALDI |
 |
|---|
| ChTry MALDI |
 |
|---|
| ArgC MALDI |
 |
|---|
| LysN MALDI |
 |
|---|
| TryLysC MALDI |
 |
|---|
| Try LTQ |
 |
|---|
| ChTry LTQ |
 |
|---|
| ArgC LTQ |
 |
|---|
| LysN LTQ |
 |
|---|
| TryLysC LTQ |
 |
|---|
| Try MSlow |
 |
|---|
| ChTry MSlow |
 |
|---|
| ArgC MSlow |
 |
|---|
| LysN MSlow |
 |
|---|
| TryLysC MSlow |
 |
|---|
| Try MShigh |
 |
|---|
| ChTry MShigh |
 |
|---|
| ArgC MShigh |
 |
|---|
| LysN MShigh |
 |
|---|
| TryLysC MShigh |
 |
|---|
General Statistics
Number of major isoforms |
Number of additional isoforms |
Number of all proteins |
Number of amino acids |
Min. Seq. Length |
Max. Seq. Length |
Avg. Seq. Length |
Avg. Mol. Weight |
|---|---|---|---|---|---|---|---|
0 |
902541 |
38 |
2902 |
322.8 |
35.65 |
Amino acid frequency
Ala |
Cys |
Asp |
Glu |
Phe |
Gly |
His |
Ile |
Lys |
Leu |
|---|---|---|---|---|---|---|---|---|---|
9.93 ± 0.059 | 1.447 ± 0.023 |
5.547 ± 0.041 | 6.258 ± 0.048 |
3.972 ± 0.031 | 8.144 ± 0.047 |
2.167 ± 0.019 | 5.543 ± 0.038 |
4.03 ± 0.046 | 11.066 ± 0.056 |
Met |
Asn |
Gln |
Pro |
Arg |
Ser |
Thr |
Val |
Trp |
Tyr |
|---|---|---|---|---|---|---|---|---|---|
2.486 ± 0.019 | 2.975 ± 0.025 |
4.66 ± 0.033 | 3.767 ± 0.032 |
7.199 ± 0.047 | 5.268 ± 0.035 |
4.735 ± 0.026 | 7.139 ± 0.039 |
1.097 ± 0.017 | 2.569 ± 0.028 |
Most of the basic statistics you can see at this page can be downloaded from this CSV file
Proteome-pI is available under Creative Commons Attribution-NoDerivs license, for more details see here
| Reference: Kozlowski LP. Proteome-pI 2.0: Proteome Isoelectric Point Database Update. Nucleic Acids Res. 2021, doi: 10.1093/nar/gkab944 | Contact: Lukasz P. Kozlowski |
