Tribolium castaneum (Red flour beetle)
Taxonomy: cellular organisms; Eukaryota; Opisthokonta; Metazoa; Eumetazoa; Bilateria; Protostomia; Ecdysozoa; Panarthropoda; Arthropoda; Mandibulata; Pancrustacea; Hexapoda; Insecta; Dicondylia; Pterygota; Neoptera; Endopterygota; Coleoptera; Polyphaga; Cucujiformia; Tenebrionoidea; Tenebrionidae;
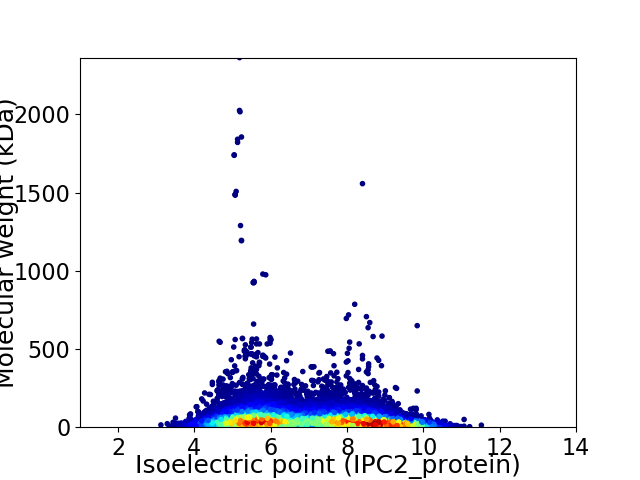
Average proteome isoelectric point is 7.01
Get precalculated fractions of proteins

Virtual 2D-PAGE plot for 18505 proteins (isoelectric point calculated using IPC2_protein)
Get csv file with sequences according to given criteria:
* You can choose from 21 different methods for calculating isoelectric point
Summary statistics related to proteome-wise predictions


Protein with the lowest isoelectric point:
>tr|A0A139WAN1|A0A139WAN1_TRICA Heat shock protein 83 OS=Tribolium castaneum OX=7070 GN=TcasGA2_TC031438 PE=3 SV=1
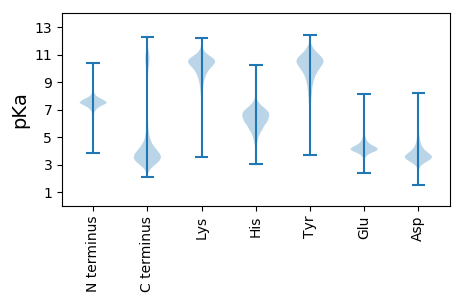
MM1 pKa = 7.0YY2 pKa = 9.66RR3 pKa = 11.84ALHH6 pKa = 5.78LTDD9 pKa = 5.22LSPEE13 pKa = 3.69FSGNYY18 pKa = 5.78TCKK21 pKa = 10.37VSGPEE26 pKa = 4.4SEE28 pKa = 5.66DD29 pKa = 3.48EE30 pKa = 4.27VTKK33 pKa = 10.76TMIIYY38 pKa = 7.69EE39 pKa = 4.34TPDD42 pKa = 3.72DD43 pKa = 4.42DD44 pKa = 5.22LEE46 pKa = 4.27LRR48 pKa = 11.84ISQEE52 pKa = 3.75DD53 pKa = 3.98SEE55 pKa = 4.91IKK57 pKa = 10.44CSSEE61 pKa = 3.9GLFPQPNMTLYY72 pKa = 10.36IMNYY76 pKa = 9.67NMTEE80 pKa = 3.79ILDD83 pKa = 3.8QEE85 pKa = 4.12NDD87 pKa = 3.35EE88 pKa = 5.21LIDD91 pKa = 4.4RR92 pKa = 11.84GDD94 pKa = 3.93DD95 pKa = 3.46GLFNVSTVLVYY106 pKa = 10.81NPEE109 pKa = 4.02EE110 pKa = 3.96LTEE113 pKa = 4.0TFYY116 pKa = 10.99YY117 pKa = 9.91ICEE120 pKa = 4.04LSIPGTPFIINEE132 pKa = 4.25TMIHH136 pKa = 5.57FQDD139 pKa = 3.49NNEE142 pKa = 3.96IQVQEE147 pKa = 4.5DD148 pKa = 3.9FNLFNSTNSTDD159 pKa = 3.5STFEE163 pKa = 3.63EE164 pKa = 4.5SKK166 pKa = 10.82EE167 pKa = 3.64IEE169 pKa = 4.16TQIEE173 pKa = 3.9EE174 pKa = 4.48EE175 pKa = 4.3YY176 pKa = 11.38DD177 pKa = 3.82FNTTTAEE184 pKa = 4.14SATNATVADD193 pKa = 4.55DD194 pKa = 5.9DD195 pKa = 5.36GDD197 pKa = 4.24DD198 pKa = 4.83DD199 pKa = 4.37EE200 pKa = 5.14STRR203 pKa = 11.84QEE205 pKa = 3.98INEE208 pKa = 4.17SSSFRR213 pKa = 11.84HH214 pKa = 5.84LSSLITSFLTTALLLSQLYY233 pKa = 8.89FF234 pKa = 3.98
MM1 pKa = 7.0YY2 pKa = 9.66RR3 pKa = 11.84ALHH6 pKa = 5.78LTDD9 pKa = 5.22LSPEE13 pKa = 3.69FSGNYY18 pKa = 5.78TCKK21 pKa = 10.37VSGPEE26 pKa = 4.4SEE28 pKa = 5.66DD29 pKa = 3.48EE30 pKa = 4.27VTKK33 pKa = 10.76TMIIYY38 pKa = 7.69EE39 pKa = 4.34TPDD42 pKa = 3.72DD43 pKa = 4.42DD44 pKa = 5.22LEE46 pKa = 4.27LRR48 pKa = 11.84ISQEE52 pKa = 3.75DD53 pKa = 3.98SEE55 pKa = 4.91IKK57 pKa = 10.44CSSEE61 pKa = 3.9GLFPQPNMTLYY72 pKa = 10.36IMNYY76 pKa = 9.67NMTEE80 pKa = 3.79ILDD83 pKa = 3.8QEE85 pKa = 4.12NDD87 pKa = 3.35EE88 pKa = 5.21LIDD91 pKa = 4.4RR92 pKa = 11.84GDD94 pKa = 3.93DD95 pKa = 3.46GLFNVSTVLVYY106 pKa = 10.81NPEE109 pKa = 4.02EE110 pKa = 3.96LTEE113 pKa = 4.0TFYY116 pKa = 10.99YY117 pKa = 9.91ICEE120 pKa = 4.04LSIPGTPFIINEE132 pKa = 4.25TMIHH136 pKa = 5.57FQDD139 pKa = 3.49NNEE142 pKa = 3.96IQVQEE147 pKa = 4.5DD148 pKa = 3.9FNLFNSTNSTDD159 pKa = 3.5STFEE163 pKa = 3.63EE164 pKa = 4.5SKK166 pKa = 10.82EE167 pKa = 3.64IEE169 pKa = 4.16TQIEE173 pKa = 3.9EE174 pKa = 4.48EE175 pKa = 4.3YY176 pKa = 11.38DD177 pKa = 3.82FNTTTAEE184 pKa = 4.14SATNATVADD193 pKa = 4.55DD194 pKa = 5.9DD195 pKa = 5.36GDD197 pKa = 4.24DD198 pKa = 4.83DD199 pKa = 4.37EE200 pKa = 5.14STRR203 pKa = 11.84QEE205 pKa = 3.98INEE208 pKa = 4.17SSSFRR213 pKa = 11.84HH214 pKa = 5.84LSSLITSFLTTALLLSQLYY233 pKa = 8.89FF234 pKa = 3.98
Molecular weight: 26.76 kDa
Isoelectric point according different methods:
Protein with the highest isoelectric point:
>tr|A0A139WI97|A0A139WI97_TRICA Uncharacterized protein OS=Tribolium castaneum OX=7070 GN=TcasGA2_TC032998 PE=4 SV=1
MM1 pKa = 7.1RR2 pKa = 11.84AKK4 pKa = 9.12WRR6 pKa = 11.84KK7 pKa = 9.1KK8 pKa = 9.32RR9 pKa = 11.84MRR11 pKa = 11.84RR12 pKa = 11.84LKK14 pKa = 10.08RR15 pKa = 11.84KK16 pKa = 7.85RR17 pKa = 11.84RR18 pKa = 11.84KK19 pKa = 8.6MRR21 pKa = 11.84ARR23 pKa = 11.84SKK25 pKa = 11.11
MM1 pKa = 7.1RR2 pKa = 11.84AKK4 pKa = 9.12WRR6 pKa = 11.84KK7 pKa = 9.1KK8 pKa = 9.32RR9 pKa = 11.84MRR11 pKa = 11.84RR12 pKa = 11.84LKK14 pKa = 10.08RR15 pKa = 11.84KK16 pKa = 7.85RR17 pKa = 11.84RR18 pKa = 11.84KK19 pKa = 8.6MRR21 pKa = 11.84ARR23 pKa = 11.84SKK25 pKa = 11.11
Molecular weight: 3.4 kDa
Isoelectric point according different methods:
Peptides (in silico digests for buttom-up proteomics)
Below you can find in silico digests of the whole proteome with Trypsin, Chymotrypsin, Trypsin+LysC, LysN, ArgC proteases suitable for different mass spec machines.| Try ESI |
 |
|---|
| ChTry ESI |
 |
|---|
| ArgC ESI |
 |
|---|
| LysN ESI |
 |
|---|
| TryLysC ESI |
 |
|---|
| Try MALDI |
 |
|---|
| ChTry MALDI |
 |
|---|
| ArgC MALDI |
 |
|---|
| LysN MALDI |
 |
|---|
| TryLysC MALDI |
 |
|---|
| Try LTQ |
 |
|---|
| ChTry LTQ |
 |
|---|
| ArgC LTQ |
 |
|---|
| LysN LTQ |
 |
|---|
| TryLysC LTQ |
 |
|---|
| Try MSlow |
 |
|---|
| ChTry MSlow |
 |
|---|
| ArgC MSlow |
 |
|---|
| LysN MSlow |
 |
|---|
| TryLysC MSlow |
 |
|---|
| Try MShigh |
 |
|---|
| ChTry MShigh |
 |
|---|
| ArgC MShigh |
 |
|---|
| LysN MShigh |
 |
|---|
| TryLysC MShigh |
 |
|---|
General Statistics
Number of major isoforms |
Number of additional isoforms |
Number of all proteins |
Number of amino acids |
Min. Seq. Length |
Max. Seq. Length |
Avg. Seq. Length |
Avg. Mol. Weight |
|---|---|---|---|---|---|---|---|
9078672 |
11 |
20792 |
490.6 |
55.46 |
Amino acid frequency
Ala |
Cys |
Asp |
Glu |
Phe |
Gly |
His |
Ile |
Lys |
Leu |
|---|---|---|---|---|---|---|---|---|---|
5.805 ± 0.018 | 2.096 ± 0.052 |
5.312 ± 0.018 | 6.874 ± 0.048 |
4.163 ± 0.02 | 5.309 ± 0.024 |
2.39 ± 0.012 | 5.797 ± 0.017 |
7.079 ± 0.039 | 9.243 ± 0.038 |
Met |
Asn |
Gln |
Pro |
Arg |
Ser |
Thr |
Val |
Trp |
Tyr |
|---|---|---|---|---|---|---|---|---|---|
2.092 ± 0.01 | 5.121 ± 0.022 |
5.257 ± 0.036 | 4.155 ± 0.017 |
5.149 ± 0.018 | 7.599 ± 0.022 |
5.86 ± 0.019 | 6.396 ± 0.017 |
1.087 ± 0.008 | 3.213 ± 0.015 |
Most of the basic statistics you can see at this page can be downloaded from this CSV file
Proteome-pI is available under Creative Commons Attribution-NoDerivs license, for more details see here
| Reference: Kozlowski LP. Proteome-pI 2.0: Proteome Isoelectric Point Database Update. Nucleic Acids Res. 2021, doi: 10.1093/nar/gkab944 | Contact: Lukasz P. Kozlowski |
