Lachancea dasiensis
Taxonomy: cellular organisms; Eukaryota; Opisthokonta; Fungi; Dikarya; Ascomycota; saccharomyceta; Saccharomycotina; Saccharomycetes; Saccharomycetales; Saccharomycetaceae; Lachancea
Average proteome isoelectric point is 6.51
Get precalculated fractions of proteins

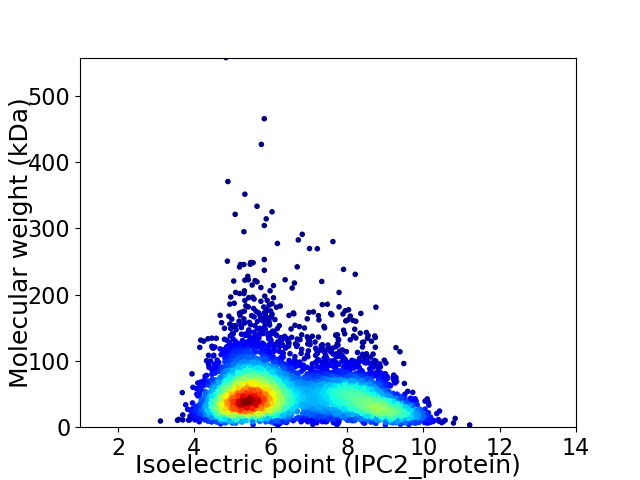
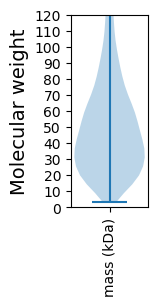
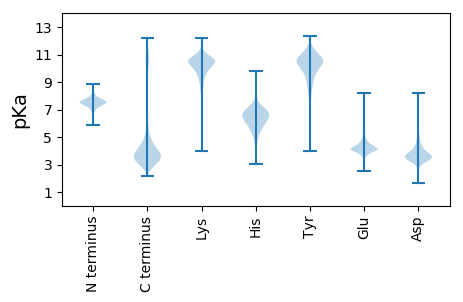
Virtual 2D-PAGE plot for 5089 proteins (isoelectric point calculated using IPC2_protein)
Get csv file with sequences according to given criteria:
* You can choose from 21 different methods for calculating isoelectric point
Summary statistics related to proteome-wise predictions


Protein with the lowest isoelectric point:
>tr|A0A1G4JBL8|A0A1G4JBL8_9SACH LADA_0E02894g1_1 OS=Lachancea dasiensis OX=1072105 GN=LADA_0E02894G PE=3 SV=1
MM1 pKa = 7.69RR2 pKa = 11.84AGLFFSALMAVATASPVALNDD23 pKa = 3.39FVKK26 pKa = 10.43RR27 pKa = 11.84DD28 pKa = 3.72SEE30 pKa = 4.31DD31 pKa = 3.45FDD33 pKa = 6.18PIEE36 pKa = 4.26AWPGNWTLSNWSNWTNSSNVTQWEE60 pKa = 4.54SPKK63 pKa = 10.55LQVFITGGHH72 pKa = 5.67YY73 pKa = 10.53KK74 pKa = 10.51LSNWTSSPDD83 pKa = 3.38VTITSLFNQTSLNATEE99 pKa = 5.02LYY101 pKa = 10.54SVASSVSKK109 pKa = 10.91SLASDD114 pKa = 4.15AYY116 pKa = 8.93TGVVVLGHH124 pKa = 6.12EE125 pKa = 4.4KK126 pKa = 10.61ALEE129 pKa = 3.95SLGFFLSVVVDD140 pKa = 3.95SPKK143 pKa = 10.99SLVVTSKK150 pKa = 11.06LDD152 pKa = 4.09DD153 pKa = 4.33GLTVAWSDD161 pKa = 3.64DD162 pKa = 3.53SWWRR166 pKa = 11.84GTLIVDD172 pKa = 3.17QTLIYY177 pKa = 10.24SGAVYY182 pKa = 9.57TPSTPGAVSIGAVYY196 pKa = 10.73DD197 pKa = 3.4KK198 pKa = 11.1TPWFWFTPAWPMLLSPEE215 pKa = 4.08STIRR219 pKa = 11.84TEE221 pKa = 3.86YY222 pKa = 10.63WNFTDD227 pKa = 5.56VIQANSTISTNGTTIPIVYY246 pKa = 9.51DD247 pKa = 3.77AYY249 pKa = 11.28YY250 pKa = 11.01NPGLLEE256 pKa = 4.03YY257 pKa = 10.58LSGSIDD263 pKa = 3.41GLVVVSSGNSTGSEE277 pKa = 4.24FTSASIPIVFASDD290 pKa = 3.15DD291 pKa = 4.11YY292 pKa = 11.85YY293 pKa = 10.65PVFVDD298 pKa = 5.12DD299 pKa = 4.63VPAGAIAAGGLSPVQSQLLLAIALTNNVTASSQLQDD335 pKa = 2.85IFFSS339 pKa = 3.76
MM1 pKa = 7.69RR2 pKa = 11.84AGLFFSALMAVATASPVALNDD23 pKa = 3.39FVKK26 pKa = 10.43RR27 pKa = 11.84DD28 pKa = 3.72SEE30 pKa = 4.31DD31 pKa = 3.45FDD33 pKa = 6.18PIEE36 pKa = 4.26AWPGNWTLSNWSNWTNSSNVTQWEE60 pKa = 4.54SPKK63 pKa = 10.55LQVFITGGHH72 pKa = 5.67YY73 pKa = 10.53KK74 pKa = 10.51LSNWTSSPDD83 pKa = 3.38VTITSLFNQTSLNATEE99 pKa = 5.02LYY101 pKa = 10.54SVASSVSKK109 pKa = 10.91SLASDD114 pKa = 4.15AYY116 pKa = 8.93TGVVVLGHH124 pKa = 6.12EE125 pKa = 4.4KK126 pKa = 10.61ALEE129 pKa = 3.95SLGFFLSVVVDD140 pKa = 3.95SPKK143 pKa = 10.99SLVVTSKK150 pKa = 11.06LDD152 pKa = 4.09DD153 pKa = 4.33GLTVAWSDD161 pKa = 3.64DD162 pKa = 3.53SWWRR166 pKa = 11.84GTLIVDD172 pKa = 3.17QTLIYY177 pKa = 10.24SGAVYY182 pKa = 9.57TPSTPGAVSIGAVYY196 pKa = 10.73DD197 pKa = 3.4KK198 pKa = 11.1TPWFWFTPAWPMLLSPEE215 pKa = 4.08STIRR219 pKa = 11.84TEE221 pKa = 3.86YY222 pKa = 10.63WNFTDD227 pKa = 5.56VIQANSTISTNGTTIPIVYY246 pKa = 9.51DD247 pKa = 3.77AYY249 pKa = 11.28YY250 pKa = 11.01NPGLLEE256 pKa = 4.03YY257 pKa = 10.58LSGSIDD263 pKa = 3.41GLVVVSSGNSTGSEE277 pKa = 4.24FTSASIPIVFASDD290 pKa = 3.15DD291 pKa = 4.11YY292 pKa = 11.85YY293 pKa = 10.65PVFVDD298 pKa = 5.12DD299 pKa = 4.63VPAGAIAAGGLSPVQSQLLLAIALTNNVTASSQLQDD335 pKa = 2.85IFFSS339 pKa = 3.76
Molecular weight: 36.59 kDa
Isoelectric point according different methods:
Protein with the highest isoelectric point:
>tr|A0A1G4JN28|A0A1G4JN28_9SACH LADA_0F14092g1_1 OS=Lachancea dasiensis OX=1072105 GN=LADA_0F14092G PE=3 SV=1
MM1 pKa = 7.1RR2 pKa = 11.84AKK4 pKa = 9.09WRR6 pKa = 11.84KK7 pKa = 8.87KK8 pKa = 8.73RR9 pKa = 11.84VRR11 pKa = 11.84RR12 pKa = 11.84LKK14 pKa = 9.71RR15 pKa = 11.84KK16 pKa = 8.27RR17 pKa = 11.84RR18 pKa = 11.84KK19 pKa = 9.19VRR21 pKa = 11.84ARR23 pKa = 11.84SKK25 pKa = 10.98
MM1 pKa = 7.1RR2 pKa = 11.84AKK4 pKa = 9.09WRR6 pKa = 11.84KK7 pKa = 8.87KK8 pKa = 8.73RR9 pKa = 11.84VRR11 pKa = 11.84RR12 pKa = 11.84LKK14 pKa = 9.71RR15 pKa = 11.84KK16 pKa = 8.27RR17 pKa = 11.84RR18 pKa = 11.84KK19 pKa = 9.19VRR21 pKa = 11.84ARR23 pKa = 11.84SKK25 pKa = 10.98
Molecular weight: 3.34 kDa
Isoelectric point according different methods:
Peptides (in silico digests for buttom-up proteomics)
Below you can find in silico digests of the whole proteome with Trypsin, Chymotrypsin, Trypsin+LysC, LysN, ArgC proteases suitable for different mass spec machines.| Try ESI |
 |
|---|
| ChTry ESI |
 |
|---|
| ArgC ESI |
 |
|---|
| LysN ESI |
 |
|---|
| TryLysC ESI |
 |
|---|
| Try MALDI |
 |
|---|
| ChTry MALDI |
 |
|---|
| ArgC MALDI |
 |
|---|
| LysN MALDI |
 |
|---|
| TryLysC MALDI |
 |
|---|
| Try LTQ |
 |
|---|
| ChTry LTQ |
 |
|---|
| ArgC LTQ |
 |
|---|
| LysN LTQ |
 |
|---|
| TryLysC LTQ |
 |
|---|
| Try MSlow |
 |
|---|
| ChTry MSlow |
 |
|---|
| ArgC MSlow |
 |
|---|
| LysN MSlow |
 |
|---|
| TryLysC MSlow |
 |
|---|
| Try MShigh |
 |
|---|
| ChTry MShigh |
 |
|---|
| ArgC MShigh |
 |
|---|
| LysN MShigh |
 |
|---|
| TryLysC MShigh |
 |
|---|
General Statistics
Number of major isoforms |
Number of additional isoforms |
Number of all proteins |
Number of amino acids |
Min. Seq. Length |
Max. Seq. Length |
Avg. Seq. Length |
Avg. Mol. Weight |
|---|---|---|---|---|---|---|---|
0 |
2476411 |
25 |
4926 |
486.6 |
54.57 |
Amino acid frequency
Ala |
Cys |
Asp |
Glu |
Phe |
Gly |
His |
Ile |
Lys |
Leu |
|---|---|---|---|---|---|---|---|---|---|
6.735 ± 0.029 | 1.323 ± 0.012 |
5.76 ± 0.025 | 6.529 ± 0.033 |
4.353 ± 0.023 | 5.687 ± 0.032 |
2.313 ± 0.015 | 5.454 ± 0.023 |
6.292 ± 0.029 | 9.932 ± 0.035 |
Met |
Asn |
Gln |
Pro |
Arg |
Ser |
Thr |
Val |
Trp |
Tyr |
|---|---|---|---|---|---|---|---|---|---|
2.067 ± 0.011 | 4.732 ± 0.018 |
4.521 ± 0.025 | 4.279 ± 0.024 |
5.074 ± 0.022 | 8.988 ± 0.042 |
5.519 ± 0.02 | 6.256 ± 0.023 |
1.103 ± 0.012 | 3.083 ± 0.016 |
Most of the basic statistics you can see at this page can be downloaded from this CSV file
Proteome-pI is available under Creative Commons Attribution-NoDerivs license, for more details see here
| Reference: Kozlowski LP. Proteome-pI 2.0: Proteome Isoelectric Point Database Update. Nucleic Acids Res. 2021, doi: 10.1093/nar/gkab944 | Contact: Lukasz P. Kozlowski |
