Lonsdalea quercina
Taxonomy: cellular organisms; Bacteria; Proteobacteria; Gammaproteobacteria; Enterobacterales; Pectobacteriaceae; Lonsdalea
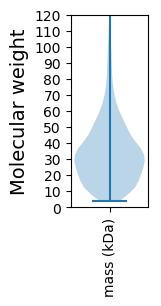
Average proteome isoelectric point is 6.52
Get precalculated fractions of proteins

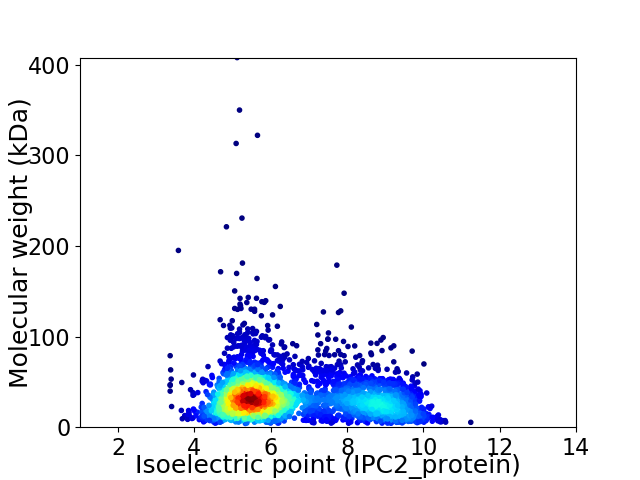
Virtual 2D-PAGE plot for 3284 proteins (isoelectric point calculated using IPC2_protein)
Get csv file with sequences according to given criteria:
* You can choose from 21 different methods for calculating isoelectric point
Summary statistics related to proteome-wise predictions


Protein with the lowest isoelectric point:
>tr|A0A1H3VJ85|A0A1H3VJ85_9GAMM Flagellar assembly protein FliH OS=Lonsdalea quercina OX=71657 GN=SAMN02982996_00018 PE=3 SV=1
MM1 pKa = 7.53GFSQAVSGLNAASSNLDD18 pKa = 3.36VIGNNIANSEE28 pKa = 4.2TTGFKK33 pKa = 10.66GATVSFADD41 pKa = 3.81IFADD45 pKa = 3.63SAVGLGVKK53 pKa = 9.71VAAVTQNFNDD63 pKa = 4.04GTIEE67 pKa = 4.04NTDD70 pKa = 3.01VGTDD74 pKa = 3.43VAISGNGFYY83 pKa = 10.37RR84 pKa = 11.84VADD87 pKa = 4.01DD88 pKa = 4.61AGSVYY93 pKa = 7.96YY94 pKa = 9.92TRR96 pKa = 11.84NGEE99 pKa = 4.13FQLDD103 pKa = 3.44ADD105 pKa = 4.82RR106 pKa = 11.84NLTTKK111 pKa = 9.0TGYY114 pKa = 10.73YY115 pKa = 7.2VTGYY119 pKa = 9.82SATGTPPTIAAGAEE133 pKa = 3.89PTTINISAGSIAAQQTSTSTYY154 pKa = 9.19VANLNSTTDD163 pKa = 3.31ALAAGTTFDD172 pKa = 3.99ATDD175 pKa = 3.08SSTYY179 pKa = 10.64SWTKK183 pKa = 11.22SMTTYY188 pKa = 11.22DD189 pKa = 3.7SLGNTHH195 pKa = 6.18VMNLYY200 pKa = 10.18FSKK203 pKa = 9.71TADD206 pKa = 3.63NTWEE210 pKa = 3.93VHH212 pKa = 6.57ALDD215 pKa = 5.07SSDD218 pKa = 3.66STATAQDD225 pKa = 3.8LGTLNFSTSGQLTGTTSFNVTTNSLNGSAANTFTIDD261 pKa = 3.63FAGSTQQNASSSEE274 pKa = 3.85LSKK277 pKa = 9.39TQNGYY282 pKa = 5.41TTGNLVEE289 pKa = 4.25YY290 pKa = 10.27AINDD294 pKa = 3.76DD295 pKa = 3.69GTINGTYY302 pKa = 10.68SNGQTQLLGQIVLATFSNNQGLKK325 pKa = 10.24SEE327 pKa = 4.53GDD329 pKa = 4.02NVWSATSSSGEE340 pKa = 3.9ASLGTAGTGLLGSLTSGALEE360 pKa = 4.04SSNVDD365 pKa = 3.13VGSEE369 pKa = 4.06LVNMIVAQRR378 pKa = 11.84NYY380 pKa = 10.23QSNAQTIKK388 pKa = 9.41TQDD391 pKa = 3.56SILNTLVNLRR401 pKa = 4.14
MM1 pKa = 7.53GFSQAVSGLNAASSNLDD18 pKa = 3.36VIGNNIANSEE28 pKa = 4.2TTGFKK33 pKa = 10.66GATVSFADD41 pKa = 3.81IFADD45 pKa = 3.63SAVGLGVKK53 pKa = 9.71VAAVTQNFNDD63 pKa = 4.04GTIEE67 pKa = 4.04NTDD70 pKa = 3.01VGTDD74 pKa = 3.43VAISGNGFYY83 pKa = 10.37RR84 pKa = 11.84VADD87 pKa = 4.01DD88 pKa = 4.61AGSVYY93 pKa = 7.96YY94 pKa = 9.92TRR96 pKa = 11.84NGEE99 pKa = 4.13FQLDD103 pKa = 3.44ADD105 pKa = 4.82RR106 pKa = 11.84NLTTKK111 pKa = 9.0TGYY114 pKa = 10.73YY115 pKa = 7.2VTGYY119 pKa = 9.82SATGTPPTIAAGAEE133 pKa = 3.89PTTINISAGSIAAQQTSTSTYY154 pKa = 9.19VANLNSTTDD163 pKa = 3.31ALAAGTTFDD172 pKa = 3.99ATDD175 pKa = 3.08SSTYY179 pKa = 10.64SWTKK183 pKa = 11.22SMTTYY188 pKa = 11.22DD189 pKa = 3.7SLGNTHH195 pKa = 6.18VMNLYY200 pKa = 10.18FSKK203 pKa = 9.71TADD206 pKa = 3.63NTWEE210 pKa = 3.93VHH212 pKa = 6.57ALDD215 pKa = 5.07SSDD218 pKa = 3.66STATAQDD225 pKa = 3.8LGTLNFSTSGQLTGTTSFNVTTNSLNGSAANTFTIDD261 pKa = 3.63FAGSTQQNASSSEE274 pKa = 3.85LSKK277 pKa = 9.39TQNGYY282 pKa = 5.41TTGNLVEE289 pKa = 4.25YY290 pKa = 10.27AINDD294 pKa = 3.76DD295 pKa = 3.69GTINGTYY302 pKa = 10.68SNGQTQLLGQIVLATFSNNQGLKK325 pKa = 10.24SEE327 pKa = 4.53GDD329 pKa = 4.02NVWSATSSSGEE340 pKa = 3.9ASLGTAGTGLLGSLTSGALEE360 pKa = 4.04SSNVDD365 pKa = 3.13VGSEE369 pKa = 4.06LVNMIVAQRR378 pKa = 11.84NYY380 pKa = 10.23QSNAQTIKK388 pKa = 9.41TQDD391 pKa = 3.56SILNTLVNLRR401 pKa = 4.14
Molecular weight: 41.4 kDa
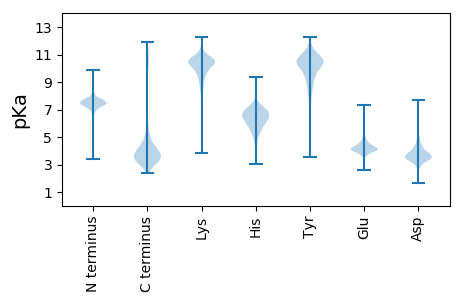
Isoelectric point according different methods:
Protein with the highest isoelectric point:
>tr|A0A1H4CKW3|A0A1H4CKW3_9GAMM Transcriptional regulator LacI family OS=Lonsdalea quercina OX=71657 GN=SAMN02982996_02012 PE=4 SV=1
MM1 pKa = 7.45KK2 pKa = 9.51RR3 pKa = 11.84TFQPSVLKK11 pKa = 10.6RR12 pKa = 11.84NRR14 pKa = 11.84SHH16 pKa = 7.16GFRR19 pKa = 11.84ARR21 pKa = 11.84MATKK25 pKa = 10.4NGRR28 pKa = 11.84QVLARR33 pKa = 11.84RR34 pKa = 11.84RR35 pKa = 11.84AKK37 pKa = 10.25GRR39 pKa = 11.84ARR41 pKa = 11.84LSVSKK46 pKa = 10.99
MM1 pKa = 7.45KK2 pKa = 9.51RR3 pKa = 11.84TFQPSVLKK11 pKa = 10.6RR12 pKa = 11.84NRR14 pKa = 11.84SHH16 pKa = 7.16GFRR19 pKa = 11.84ARR21 pKa = 11.84MATKK25 pKa = 10.4NGRR28 pKa = 11.84QVLARR33 pKa = 11.84RR34 pKa = 11.84RR35 pKa = 11.84AKK37 pKa = 10.25GRR39 pKa = 11.84ARR41 pKa = 11.84LSVSKK46 pKa = 10.99
Molecular weight: 5.37 kDa
Isoelectric point according different methods:
Peptides (in silico digests for buttom-up proteomics)
Below you can find in silico digests of the whole proteome with Trypsin, Chymotrypsin, Trypsin+LysC, LysN, ArgC proteases suitable for different mass spec machines.| Try ESI |
 |
|---|
| ChTry ESI |
 |
|---|
| ArgC ESI |
 |
|---|
| LysN ESI |
 |
|---|
| TryLysC ESI |
 |
|---|
| Try MALDI |
 |
|---|
| ChTry MALDI |
 |
|---|
| ArgC MALDI |
 |
|---|
| LysN MALDI |
 |
|---|
| TryLysC MALDI |
 |
|---|
| Try LTQ |
 |
|---|
| ChTry LTQ |
 |
|---|
| ArgC LTQ |
 |
|---|
| LysN LTQ |
 |
|---|
| TryLysC LTQ |
 |
|---|
| Try MSlow |
 |
|---|
| ChTry MSlow |
 |
|---|
| ArgC MSlow |
 |
|---|
| LysN MSlow |
 |
|---|
| TryLysC MSlow |
 |
|---|
| Try MShigh |
 |
|---|
| ChTry MShigh |
 |
|---|
| ArgC MShigh |
 |
|---|
| LysN MShigh |
 |
|---|
| TryLysC MShigh |
 |
|---|
General Statistics
Number of major isoforms |
Number of additional isoforms |
Number of all proteins |
Number of amino acids |
Min. Seq. Length |
Max. Seq. Length |
Avg. Seq. Length |
Avg. Mol. Weight |
|---|---|---|---|---|---|---|---|
0 |
1066459 |
40 |
3730 |
324.7 |
35.89 |
Amino acid frequency
Ala |
Cys |
Asp |
Glu |
Phe |
Gly |
His |
Ile |
Lys |
Leu |
|---|---|---|---|---|---|---|---|---|---|
9.73 ± 0.045 | 1.052 ± 0.015 |
5.344 ± 0.032 | 5.574 ± 0.038 |
3.663 ± 0.023 | 7.335 ± 0.038 |
2.347 ± 0.023 | 5.553 ± 0.037 |
3.787 ± 0.04 | 11.124 ± 0.063 |
Met |
Asn |
Gln |
Pro |
Arg |
Ser |
Thr |
Val |
Trp |
Tyr |
|---|---|---|---|---|---|---|---|---|---|
2.62 ± 0.021 | 3.529 ± 0.033 |
4.621 ± 0.03 | 4.737 ± 0.038 |
6.107 ± 0.045 | 6.23 ± 0.044 |
5.392 ± 0.029 | 7.084 ± 0.031 |
1.373 ± 0.016 | 2.799 ± 0.024 |
Most of the basic statistics you can see at this page can be downloaded from this CSV file
Proteome-pI is available under Creative Commons Attribution-NoDerivs license, for more details see here
| Reference: Kozlowski LP. Proteome-pI 2.0: Proteome Isoelectric Point Database Update. Nucleic Acids Res. 2021, doi: 10.1093/nar/gkab944 | Contact: Lukasz P. Kozlowski |
