Microbacterium phage FuzzBuster
Taxonomy: Viruses; Duplodnaviria; Heunggongvirae; Uroviricota; Caudoviricetes; Caudovirales; Siphoviridae; unclassified Siphoviridae
Average proteome isoelectric point is 6.27
Get precalculated fractions of proteins

Virtual 2D-PAGE plot for 85 proteins (isoelectric point calculated using IPC2_protein)
Get csv file with sequences according to given criteria:
* You can choose from 21 different methods for calculating isoelectric point
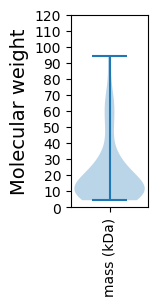
Summary statistics related to proteome-wise predictions


Protein with the lowest isoelectric point:
>tr|A0A516KV06|A0A516KV06_9CAUD Uncharacterized protein OS=Microbacterium phage FuzzBuster OX=2590935 GN=30 PE=4 SV=1
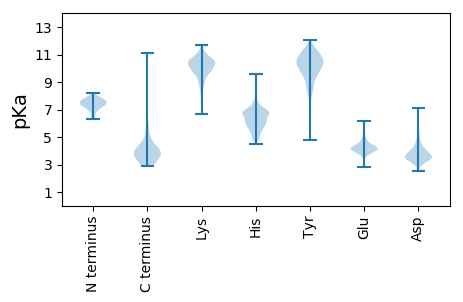
MM1 pKa = 7.41ATHH4 pKa = 6.89CFIPVLGKK12 pKa = 10.22RR13 pKa = 11.84LRR15 pKa = 11.84ATEE18 pKa = 4.3LDD20 pKa = 3.16ACGVVTPSTSLEE32 pKa = 3.99VTTDD36 pKa = 3.13GFITITLSSEE46 pKa = 4.1VEE48 pKa = 4.11EE49 pKa = 4.49GTEE52 pKa = 3.62ILQRR56 pKa = 11.84NAAGQLCVNQKK67 pKa = 9.82QADD70 pKa = 3.74SFKK73 pKa = 10.6RR74 pKa = 11.84FTVEE78 pKa = 4.88IEE80 pKa = 4.1FCGVNPSLLSIVSNAEE96 pKa = 3.6PYY98 pKa = 10.39EE99 pKa = 4.58DD100 pKa = 3.78YY101 pKa = 11.32AGDD104 pKa = 3.53VAGFTVPEE112 pKa = 4.14GEE114 pKa = 4.11ITKK117 pKa = 10.46KK118 pKa = 10.26FALEE122 pKa = 3.88LWTGLSGQACLPGEE136 pKa = 4.49AQDD139 pKa = 3.78EE140 pKa = 4.46ASGYY144 pKa = 8.84MLLPFVQAGVLGDD157 pKa = 3.39ITIDD161 pKa = 3.51GEE163 pKa = 4.32NAVTFSITGAYY174 pKa = 8.5TIGGNAWLNGPYY186 pKa = 10.15NVLRR190 pKa = 11.84NVEE193 pKa = 4.13GDD195 pKa = 3.7PAVLPLALDD204 pKa = 4.09PFDD207 pKa = 5.2HH208 pKa = 6.94LLLVDD213 pKa = 4.13TALAPPPVACSPTAVAPLPPVAATGAIAGNPGTFQPGGATVPANLAAMASLTASPNTAWTTGQHH277 pKa = 5.07VVLGDD282 pKa = 3.48ASHH285 pKa = 7.05AYY287 pKa = 9.02WDD289 pKa = 3.99GDD291 pKa = 3.12SWAAGDD297 pKa = 4.21APP299 pKa = 4.27
MM1 pKa = 7.41ATHH4 pKa = 6.89CFIPVLGKK12 pKa = 10.22RR13 pKa = 11.84LRR15 pKa = 11.84ATEE18 pKa = 4.3LDD20 pKa = 3.16ACGVVTPSTSLEE32 pKa = 3.99VTTDD36 pKa = 3.13GFITITLSSEE46 pKa = 4.1VEE48 pKa = 4.11EE49 pKa = 4.49GTEE52 pKa = 3.62ILQRR56 pKa = 11.84NAAGQLCVNQKK67 pKa = 9.82QADD70 pKa = 3.74SFKK73 pKa = 10.6RR74 pKa = 11.84FTVEE78 pKa = 4.88IEE80 pKa = 4.1FCGVNPSLLSIVSNAEE96 pKa = 3.6PYY98 pKa = 10.39EE99 pKa = 4.58DD100 pKa = 3.78YY101 pKa = 11.32AGDD104 pKa = 3.53VAGFTVPEE112 pKa = 4.14GEE114 pKa = 4.11ITKK117 pKa = 10.46KK118 pKa = 10.26FALEE122 pKa = 3.88LWTGLSGQACLPGEE136 pKa = 4.49AQDD139 pKa = 3.78EE140 pKa = 4.46ASGYY144 pKa = 8.84MLLPFVQAGVLGDD157 pKa = 3.39ITIDD161 pKa = 3.51GEE163 pKa = 4.32NAVTFSITGAYY174 pKa = 8.5TIGGNAWLNGPYY186 pKa = 10.15NVLRR190 pKa = 11.84NVEE193 pKa = 4.13GDD195 pKa = 3.7PAVLPLALDD204 pKa = 4.09PFDD207 pKa = 5.2HH208 pKa = 6.94LLLVDD213 pKa = 4.13TALAPPPVACSPTAVAPLPPVAATGAIAGNPGTFQPGGATVPANLAAMASLTASPNTAWTTGQHH277 pKa = 5.07VVLGDD282 pKa = 3.48ASHH285 pKa = 7.05AYY287 pKa = 9.02WDD289 pKa = 3.99GDD291 pKa = 3.12SWAAGDD297 pKa = 4.21APP299 pKa = 4.27
Molecular weight: 30.92 kDa
Isoelectric point according different methods:
Protein with the highest isoelectric point:
>tr|A0A516KV25|A0A516KV25_9CAUD Uncharacterized protein OS=Microbacterium phage FuzzBuster OX=2590935 GN=59 PE=4 SV=1
MM1 pKa = 7.26MSKK4 pKa = 8.48TCEE7 pKa = 3.93TGKK10 pKa = 9.93VRR12 pKa = 11.84HH13 pKa = 5.95TSLARR18 pKa = 11.84AKK20 pKa = 9.02TAAHH24 pKa = 6.43AFARR28 pKa = 11.84EE29 pKa = 3.9LNRR32 pKa = 11.84EE33 pKa = 3.6KK34 pKa = 10.75RR35 pKa = 11.84IAQNMYY41 pKa = 10.1AYY43 pKa = 10.2RR44 pKa = 11.84CSTCRR49 pKa = 11.84GWHH52 pKa = 5.61LTRR55 pKa = 11.84QAGWSNVTLVMQAAPEE71 pKa = 4.08SLQRR75 pKa = 11.84WAMDD79 pKa = 3.32GG80 pKa = 3.41
MM1 pKa = 7.26MSKK4 pKa = 8.48TCEE7 pKa = 3.93TGKK10 pKa = 9.93VRR12 pKa = 11.84HH13 pKa = 5.95TSLARR18 pKa = 11.84AKK20 pKa = 9.02TAAHH24 pKa = 6.43AFARR28 pKa = 11.84EE29 pKa = 3.9LNRR32 pKa = 11.84EE33 pKa = 3.6KK34 pKa = 10.75RR35 pKa = 11.84IAQNMYY41 pKa = 10.1AYY43 pKa = 10.2RR44 pKa = 11.84CSTCRR49 pKa = 11.84GWHH52 pKa = 5.61LTRR55 pKa = 11.84QAGWSNVTLVMQAAPEE71 pKa = 4.08SLQRR75 pKa = 11.84WAMDD79 pKa = 3.32GG80 pKa = 3.41
Molecular weight: 9.13 kDa
Isoelectric point according different methods:
Peptides (in silico digests for buttom-up proteomics)
Below you can find in silico digests of the whole proteome with Trypsin, Chymotrypsin, Trypsin+LysC, LysN, ArgC proteases suitable for different mass spec machines.| Try ESI |
 |
|---|
| ChTry ESI |
 |
|---|
| ArgC ESI |
 |
|---|
| LysN ESI |
 |
|---|
| TryLysC ESI |
 |
|---|
| Try MALDI |
 |
|---|
| ChTry MALDI |
 |
|---|
| ArgC MALDI |
 |
|---|
| LysN MALDI |
 |
|---|
| TryLysC MALDI |
 |
|---|
| Try LTQ |
 |
|---|
| ChTry LTQ |
 |
|---|
| ArgC LTQ |
 |
|---|
| LysN LTQ |
 |
|---|
| TryLysC LTQ |
 |
|---|
| Try MSlow |
 |
|---|
| ChTry MSlow |
 |
|---|
| ArgC MSlow |
 |
|---|
| LysN MSlow |
 |
|---|
| TryLysC MSlow |
 |
|---|
| Try MShigh |
 |
|---|
| ChTry MShigh |
 |
|---|
| ArgC MShigh |
 |
|---|
| LysN MShigh |
 |
|---|
| TryLysC MShigh |
 |
|---|
General Statistics
Number of major isoforms |
Number of additional isoforms |
Number of all proteins |
Number of amino acids |
Min. Seq. Length |
Max. Seq. Length |
Avg. Seq. Length |
Avg. Mol. Weight |
|---|---|---|---|---|---|---|---|
0 |
17508 |
39 |
931 |
206.0 |
22.31 |
Amino acid frequency
Ala |
Cys |
Asp |
Glu |
Phe |
Gly |
His |
Ile |
Lys |
Leu |
|---|---|---|---|---|---|---|---|---|---|
12.68 ± 0.378 | 0.937 ± 0.138 |
6.271 ± 0.29 | 6.963 ± 0.377 |
2.565 ± 0.134 | 8.625 ± 0.267 |
1.948 ± 0.166 | 4.963 ± 0.252 |
3.456 ± 0.388 | 7.716 ± 0.399 |
Met |
Asn |
Gln |
Pro |
Arg |
Ser |
Thr |
Val |
Trp |
Tyr |
|---|---|---|---|---|---|---|---|---|---|
2.21 ± 0.123 | 2.445 ± 0.169 |
5.826 ± 0.232 | 3.061 ± 0.145 |
7.18 ± 0.476 | 5.426 ± 0.253 |
6.785 ± 0.255 | 6.98 ± 0.214 |
1.902 ± 0.155 | 2.062 ± 0.169 |
Most of the basic statistics you can see at this page can be downloaded from this CSV file
Proteome-pI is available under Creative Commons Attribution-NoDerivs license, for more details see here
| Reference: Kozlowski LP. Proteome-pI 2.0: Proteome Isoelectric Point Database Update. Nucleic Acids Res. 2021, doi: 10.1093/nar/gkab944 | Contact: Lukasz P. Kozlowski |
