Porcine reproductive and respiratory syndrome virus (PRRSV)
Taxonomy: Viruses; Riboviria; Orthornavirae; Pisuviricota; Pisoniviricetes; Nidovirales; Arnidovirineae; Arteriviridae; unclassified Arteriviridae
Average proteome isoelectric point is 7.75
Get precalculated fractions of proteins

Virtual 2D-PAGE plot for 9 proteins (isoelectric point calculated using IPC2_protein)
Get csv file with sequences according to given criteria:
* You can choose from 21 different methods for calculating isoelectric point
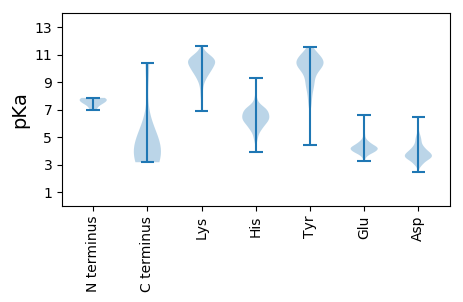
Summary statistics related to proteome-wise predictions


Protein with the lowest isoelectric point:
>tr|Q9PX06|Q9PX06_PRRSV Isoform of Q6PR42 2b OS=Porcine reproductive and respiratory syndrome virus OX=28344 GN=ORF2a PE=4 SV=1
MM1 pKa = 7.73GSMQSLFDD9 pKa = 4.68KK10 pKa = 10.64IGQLFVDD17 pKa = 4.8AFTEE21 pKa = 4.33FLVSIVDD28 pKa = 3.88IIIFLAILFGFTIAGWLVVFCIRR51 pKa = 11.84LVCSAILRR59 pKa = 11.84TRR61 pKa = 11.84PAIHH65 pKa = 6.66SEE67 pKa = 3.9QLQKK71 pKa = 10.73ILL73 pKa = 4.36
MM1 pKa = 7.73GSMQSLFDD9 pKa = 4.68KK10 pKa = 10.64IGQLFVDD17 pKa = 4.8AFTEE21 pKa = 4.33FLVSIVDD28 pKa = 3.88IIIFLAILFGFTIAGWLVVFCIRR51 pKa = 11.84LVCSAILRR59 pKa = 11.84TRR61 pKa = 11.84PAIHH65 pKa = 6.66SEE67 pKa = 3.9QLQKK71 pKa = 10.73ILL73 pKa = 4.36
Molecular weight: 8.22 kDa
Isoelectric point according different methods:
Protein with the highest isoelectric point:
>tr|Q6PR44|Q6PR44_PRRSV Non-structural protein 3 OS=Porcine reproductive and respiratory syndrome virus OX=28344 GN=ORF1a PE=4 SV=1
MM1 pKa = 7.49KK2 pKa = 9.85WGPCKK7 pKa = 10.65AFLTKK12 pKa = 10.5LANFLWMLSRR22 pKa = 11.84SSWCPLLISLYY33 pKa = 10.16FWPFCLASPSPVGWWSFASDD53 pKa = 3.08WFAPRR58 pKa = 11.84YY59 pKa = 8.69SVRR62 pKa = 11.84ALPFTLSNYY71 pKa = 8.46RR72 pKa = 11.84RR73 pKa = 11.84SYY75 pKa = 10.8EE76 pKa = 3.95AFLSQCQVDD85 pKa = 3.39IPTWGTKK92 pKa = 9.92HH93 pKa = 6.3PLGLLWHH100 pKa = 6.76HH101 pKa = 6.37KK102 pKa = 10.16VSTLIDD108 pKa = 3.53EE109 pKa = 4.49MVSRR113 pKa = 11.84RR114 pKa = 11.84MYY116 pKa = 10.64RR117 pKa = 11.84IMEE120 pKa = 4.22KK121 pKa = 10.19SGQAAWKK128 pKa = 9.72QVVSEE133 pKa = 4.27ATLSRR138 pKa = 11.84ISSLDD143 pKa = 3.43VVAHH147 pKa = 6.05FQHH150 pKa = 6.68LAAIEE155 pKa = 4.4AEE157 pKa = 4.33TCKK160 pKa = 10.76YY161 pKa = 9.79LASRR165 pKa = 11.84LPMLHH170 pKa = 6.56NLRR173 pKa = 11.84MTGSNVTIVYY183 pKa = 10.47NSTLNQVFAIFPTPGSRR200 pKa = 11.84PKK202 pKa = 10.85LHH204 pKa = 7.62DD205 pKa = 3.61FQQWLIAVHH214 pKa = 6.43SSIFSSVAASCTLFVVLWLRR234 pKa = 11.84VPILRR239 pKa = 11.84TVFGFRR245 pKa = 11.84WLGAIFLSNSQQ256 pKa = 3.17
MM1 pKa = 7.49KK2 pKa = 9.85WGPCKK7 pKa = 10.65AFLTKK12 pKa = 10.5LANFLWMLSRR22 pKa = 11.84SSWCPLLISLYY33 pKa = 10.16FWPFCLASPSPVGWWSFASDD53 pKa = 3.08WFAPRR58 pKa = 11.84YY59 pKa = 8.69SVRR62 pKa = 11.84ALPFTLSNYY71 pKa = 8.46RR72 pKa = 11.84RR73 pKa = 11.84SYY75 pKa = 10.8EE76 pKa = 3.95AFLSQCQVDD85 pKa = 3.39IPTWGTKK92 pKa = 9.92HH93 pKa = 6.3PLGLLWHH100 pKa = 6.76HH101 pKa = 6.37KK102 pKa = 10.16VSTLIDD108 pKa = 3.53EE109 pKa = 4.49MVSRR113 pKa = 11.84RR114 pKa = 11.84MYY116 pKa = 10.64RR117 pKa = 11.84IMEE120 pKa = 4.22KK121 pKa = 10.19SGQAAWKK128 pKa = 9.72QVVSEE133 pKa = 4.27ATLSRR138 pKa = 11.84ISSLDD143 pKa = 3.43VVAHH147 pKa = 6.05FQHH150 pKa = 6.68LAAIEE155 pKa = 4.4AEE157 pKa = 4.33TCKK160 pKa = 10.76YY161 pKa = 9.79LASRR165 pKa = 11.84LPMLHH170 pKa = 6.56NLRR173 pKa = 11.84MTGSNVTIVYY183 pKa = 10.47NSTLNQVFAIFPTPGSRR200 pKa = 11.84PKK202 pKa = 10.85LHH204 pKa = 7.62DD205 pKa = 3.61FQQWLIAVHH214 pKa = 6.43SSIFSSVAASCTLFVVLWLRR234 pKa = 11.84VPILRR239 pKa = 11.84TVFGFRR245 pKa = 11.84WLGAIFLSNSQQ256 pKa = 3.17
Molecular weight: 29.39 kDa
Isoelectric point according different methods:
Peptides (in silico digests for buttom-up proteomics)
Below you can find in silico digests of the whole proteome with Trypsin, Chymotrypsin, Trypsin+LysC, LysN, ArgC proteases suitable for different mass spec machines.| Try ESI |
 |
|---|
| ChTry ESI |
 |
|---|
| ArgC ESI |
 |
|---|
| LysN ESI |
 |
|---|
| TryLysC ESI |
 |
|---|
| Try MALDI |
 |
|---|
| ChTry MALDI |
 |
|---|
| ArgC MALDI |
 |
|---|
| LysN MALDI |
 |
|---|
| TryLysC MALDI |
 |
|---|
| Try LTQ |
 |
|---|
| ChTry LTQ |
 |
|---|
| ArgC LTQ |
 |
|---|
| LysN LTQ |
 |
|---|
| TryLysC LTQ |
 |
|---|
| Try MSlow |
 |
|---|
| ChTry MSlow |
 |
|---|
| ArgC MSlow |
 |
|---|
| LysN MSlow |
 |
|---|
| TryLysC MSlow |
 |
|---|
| Try MShigh |
 |
|---|
| ChTry MShigh |
 |
|---|
| ArgC MShigh |
 |
|---|
| LysN MShigh |
 |
|---|
| TryLysC MShigh |
 |
|---|
General Statistics
Number of major isoforms |
Number of additional isoforms |
Number of all proteins |
Number of amino acids |
Min. Seq. Length |
Max. Seq. Length |
Avg. Seq. Length |
Avg. Mol. Weight |
|---|---|---|---|---|---|---|---|
5218 |
73 |
2503 |
579.8 |
63.8 |
Amino acid frequency
Ala |
Cys |
Asp |
Glu |
Phe |
Gly |
His |
Ile |
Lys |
Leu |
|---|---|---|---|---|---|---|---|---|---|
8.432 ± 0.425 | 3.085 ± 0.218 |
4.427 ± 0.548 | 4.293 ± 0.458 |
4.561 ± 0.581 | 7.11 ± 0.701 |
2.587 ± 0.318 | 4.044 ± 0.472 |
4.484 ± 0.352 | 10.33 ± 0.385 |
Met |
Asn |
Gln |
Pro |
Arg |
Ser |
Thr |
Val |
Trp |
Tyr |
|---|---|---|---|---|---|---|---|---|---|
1.955 ± 0.169 | 3.085 ± 0.146 |
6.784 ± 0.889 | 3.22 ± 0.321 |
5.424 ± 0.152 | 7.11 ± 0.715 |
5.96 ± 0.351 | 8.49 ± 0.34 |
1.84 ± 0.298 | 2.779 ± 0.586 |
Most of the basic statistics you can see at this page can be downloaded from this CSV file
Proteome-pI is available under Creative Commons Attribution-NoDerivs license, for more details see here
| Reference: Kozlowski LP. Proteome-pI 2.0: Proteome Isoelectric Point Database Update. Nucleic Acids Res. 2021, doi: 10.1093/nar/gkab944 | Contact: Lukasz P. Kozlowski |
