Hamiltosporidium tvaerminnensis
Taxonomy: cellular organisms; Eukaryota; Opisthokonta; Fungi; Fungi incertae sedis; Microsporidia; Pansporoblastina; Dubosqiidae; Hamiltosporidium
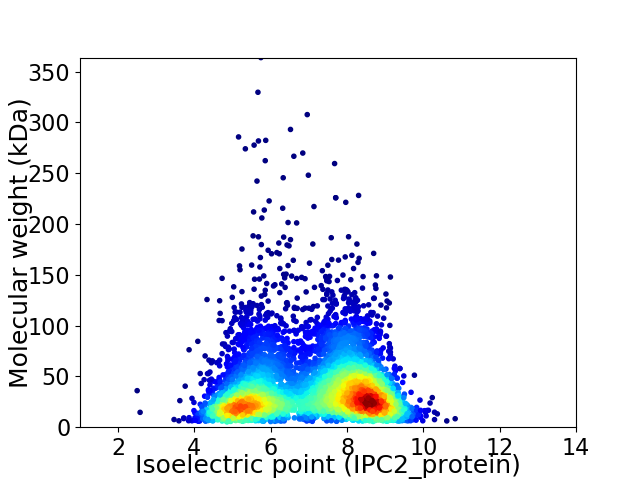
Average proteome isoelectric point is 7.0
Get precalculated fractions of proteins

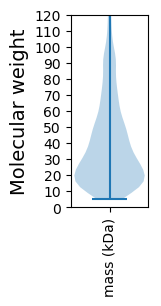
Virtual 2D-PAGE plot for 5820 proteins (isoelectric point calculated using IPC2_protein)
Get csv file with sequences according to given criteria:
* You can choose from 21 different methods for calculating isoelectric point
Summary statistics related to proteome-wise predictions


Protein with the lowest isoelectric point:
>tr|A0A4Q9LPJ8|A0A4Q9LPJ8_9MICR Uncharacterized protein OS=Hamiltosporidium tvaerminnensis OX=1176355 GN=CWI38_1824p0010 PE=4 SV=1
MM1 pKa = 7.44IISWLSLYY9 pKa = 11.23LLFTYY14 pKa = 10.75VMIVKK19 pKa = 9.75PNEE22 pKa = 3.92SDD24 pKa = 4.2SIQAPGSYY32 pKa = 9.63IYY34 pKa = 10.19TLYY37 pKa = 11.39GNLNTDD43 pKa = 3.63EE44 pKa = 4.96GPNSGSGFTRR54 pKa = 11.84TNSGGNGMDD63 pKa = 3.44NSPVNGFNAHH73 pKa = 6.34SFTNNYY79 pKa = 9.23FPLDD83 pKa = 3.79NPSVIGLWFGLNDD96 pKa = 3.6AFEE99 pKa = 4.55TVAPVSMDD107 pKa = 3.16QTNGTNDD114 pKa = 3.54LADD117 pKa = 3.72YY118 pKa = 8.83TPNDD122 pKa = 4.2SITFGNNGIEE132 pKa = 4.22EE133 pKa = 4.51SEE135 pKa = 5.05IMDD138 pKa = 4.1QTNMDD143 pKa = 4.02TNSTYY148 pKa = 10.76QSTMFCGNGDD158 pKa = 3.85SVALGSAAMEE168 pKa = 3.89QNIIDD173 pKa = 4.0EE174 pKa = 4.75DD175 pKa = 4.52RR176 pKa = 11.84NSDD179 pKa = 3.69MLVEE183 pKa = 4.46NQNHH187 pKa = 6.84DD188 pKa = 3.48NPLFLGSTVDD198 pKa = 3.37EE199 pKa = 4.16ATKK202 pKa = 10.62NGRR205 pKa = 11.84QLYY208 pKa = 6.07TTSLSDD214 pKa = 3.81KK215 pKa = 10.83DD216 pKa = 4.65DD217 pKa = 4.51LFFLDD222 pKa = 4.37EE223 pKa = 4.99LDD225 pKa = 4.61LVFISDD231 pKa = 4.79AIEE234 pKa = 4.22SKK236 pKa = 10.63IKK238 pKa = 10.67
MM1 pKa = 7.44IISWLSLYY9 pKa = 11.23LLFTYY14 pKa = 10.75VMIVKK19 pKa = 9.75PNEE22 pKa = 3.92SDD24 pKa = 4.2SIQAPGSYY32 pKa = 9.63IYY34 pKa = 10.19TLYY37 pKa = 11.39GNLNTDD43 pKa = 3.63EE44 pKa = 4.96GPNSGSGFTRR54 pKa = 11.84TNSGGNGMDD63 pKa = 3.44NSPVNGFNAHH73 pKa = 6.34SFTNNYY79 pKa = 9.23FPLDD83 pKa = 3.79NPSVIGLWFGLNDD96 pKa = 3.6AFEE99 pKa = 4.55TVAPVSMDD107 pKa = 3.16QTNGTNDD114 pKa = 3.54LADD117 pKa = 3.72YY118 pKa = 8.83TPNDD122 pKa = 4.2SITFGNNGIEE132 pKa = 4.22EE133 pKa = 4.51SEE135 pKa = 5.05IMDD138 pKa = 4.1QTNMDD143 pKa = 4.02TNSTYY148 pKa = 10.76QSTMFCGNGDD158 pKa = 3.85SVALGSAAMEE168 pKa = 3.89QNIIDD173 pKa = 4.0EE174 pKa = 4.75DD175 pKa = 4.52RR176 pKa = 11.84NSDD179 pKa = 3.69MLVEE183 pKa = 4.46NQNHH187 pKa = 6.84DD188 pKa = 3.48NPLFLGSTVDD198 pKa = 3.37EE199 pKa = 4.16ATKK202 pKa = 10.62NGRR205 pKa = 11.84QLYY208 pKa = 6.07TTSLSDD214 pKa = 3.81KK215 pKa = 10.83DD216 pKa = 4.65DD217 pKa = 4.51LFFLDD222 pKa = 4.37EE223 pKa = 4.99LDD225 pKa = 4.61LVFISDD231 pKa = 4.79AIEE234 pKa = 4.22SKK236 pKa = 10.63IKK238 pKa = 10.67
Molecular weight: 26.13 kDa
Isoelectric point according different methods:
Protein with the highest isoelectric point:
>tr|A0A4Q9KQL9|A0A4Q9KQL9_9MICR Putative subunit 2 of mRNA decapping complex OS=Hamiltosporidium tvaerminnensis OX=1176355 GN=CWI37_2600p0020 PE=3 SV=1
MM1 pKa = 7.1NRR3 pKa = 11.84KK4 pKa = 9.08KK5 pKa = 10.83LFLWIIQLTIILNFIKK21 pKa = 10.4RR22 pKa = 11.84VSKK25 pKa = 11.06VNAGYY30 pKa = 10.07SRR32 pKa = 11.84RR33 pKa = 11.84SYY35 pKa = 10.43SSRR38 pKa = 11.84NIRR41 pKa = 11.84RR42 pKa = 11.84SSGCSGGRR50 pKa = 11.84QGGGGCKK57 pKa = 10.08GGSCSGGRR65 pKa = 11.84QGGGGCKK72 pKa = 10.08GGSCSGGRR80 pKa = 11.84QGGGGCKK87 pKa = 10.08GGSCSGGRR95 pKa = 11.84QGGGGCKK102 pKa = 10.08GGSCSGGRR110 pKa = 11.84QGGGGGCSSCGGGGCSSCGGRR131 pKa = 11.84NPRR134 pKa = 4.07
MM1 pKa = 7.1NRR3 pKa = 11.84KK4 pKa = 9.08KK5 pKa = 10.83LFLWIIQLTIILNFIKK21 pKa = 10.4RR22 pKa = 11.84VSKK25 pKa = 11.06VNAGYY30 pKa = 10.07SRR32 pKa = 11.84RR33 pKa = 11.84SYY35 pKa = 10.43SSRR38 pKa = 11.84NIRR41 pKa = 11.84RR42 pKa = 11.84SSGCSGGRR50 pKa = 11.84QGGGGCKK57 pKa = 10.08GGSCSGGRR65 pKa = 11.84QGGGGCKK72 pKa = 10.08GGSCSGGRR80 pKa = 11.84QGGGGCKK87 pKa = 10.08GGSCSGGRR95 pKa = 11.84QGGGGCKK102 pKa = 10.08GGSCSGGRR110 pKa = 11.84QGGGGGCSSCGGGGCSSCGGRR131 pKa = 11.84NPRR134 pKa = 4.07
Molecular weight: 12.87 kDa
Isoelectric point according different methods:
Peptides (in silico digests for buttom-up proteomics)
Below you can find in silico digests of the whole proteome with Trypsin, Chymotrypsin, Trypsin+LysC, LysN, ArgC proteases suitable for different mass spec machines.| Try ESI |
 |
|---|
| ChTry ESI |
 |
|---|
| ArgC ESI |
 |
|---|
| LysN ESI |
 |
|---|
| TryLysC ESI |
 |
|---|
| Try MALDI |
 |
|---|
| ChTry MALDI |
 |
|---|
| ArgC MALDI |
 |
|---|
| LysN MALDI |
 |
|---|
| TryLysC MALDI |
 |
|---|
| Try LTQ |
 |
|---|
| ChTry LTQ |
 |
|---|
| ArgC LTQ |
 |
|---|
| LysN LTQ |
 |
|---|
| TryLysC LTQ |
 |
|---|
| Try MSlow |
 |
|---|
| ChTry MSlow |
 |
|---|
| ArgC MSlow |
 |
|---|
| LysN MSlow |
 |
|---|
| TryLysC MSlow |
 |
|---|
| Try MShigh |
 |
|---|
| ChTry MShigh |
 |
|---|
| ArgC MShigh |
 |
|---|
| LysN MShigh |
 |
|---|
| TryLysC MShigh |
 |
|---|
General Statistics
Number of major isoforms |
Number of additional isoforms |
Number of all proteins |
Number of amino acids |
Min. Seq. Length |
Max. Seq. Length |
Avg. Seq. Length |
Avg. Mol. Weight |
|---|---|---|---|---|---|---|---|
0 |
2114574 |
46 |
3235 |
363.3 |
42.32 |
Amino acid frequency
Ala |
Cys |
Asp |
Glu |
Phe |
Gly |
His |
Ile |
Lys |
Leu |
|---|---|---|---|---|---|---|---|---|---|
2.597 ± 0.028 | 1.944 ± 0.013 |
5.194 ± 0.021 | 7.601 ± 0.041 |
5.966 ± 0.04 | 3.606 ± 0.035 |
1.71 ± 0.012 | 9.726 ± 0.035 |
9.811 ± 0.04 | 9.523 ± 0.034 |
Met |
Asn |
Gln |
Pro |
Arg |
Ser |
Thr |
Val |
Trp |
Tyr |
|---|---|---|---|---|---|---|---|---|---|
1.934 ± 0.014 | 8.671 ± 0.056 |
2.64 ± 0.024 | 2.48 ± 0.017 |
3.785 ± 0.023 | 7.825 ± 0.031 |
5.062 ± 0.03 | 4.813 ± 0.029 |
0.528 ± 0.006 | 4.584 ± 0.023 |
Most of the basic statistics you can see at this page can be downloaded from this CSV file
Proteome-pI is available under Creative Commons Attribution-NoDerivs license, for more details see here
| Reference: Kozlowski LP. Proteome-pI 2.0: Proteome Isoelectric Point Database Update. Nucleic Acids Res. 2021, doi: 10.1093/nar/gkab944 | Contact: Lukasz P. Kozlowski |
