Streptomyces sp. CNQ-509
Taxonomy: cellular organisms; Bacteria; Terrabacteria group; Actinobacteria; Actinomycetia; Streptomycetales; Streptomycetaceae; Streptomyces; unclassified Streptomyces
Average proteome isoelectric point is 6.29
Get precalculated fractions of proteins

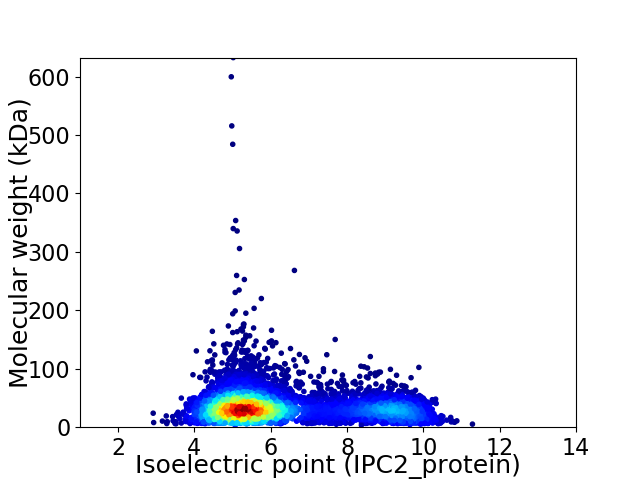
Virtual 2D-PAGE plot for 6367 proteins (isoelectric point calculated using IPC2_protein)
Get csv file with sequences according to given criteria:
* You can choose from 21 different methods for calculating isoelectric point
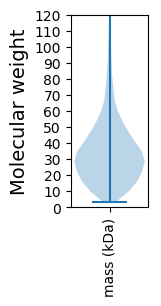
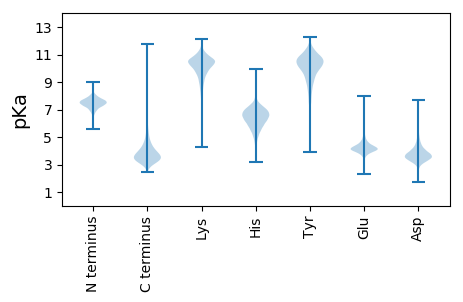
Summary statistics related to proteome-wise predictions


Protein with the lowest isoelectric point:
>tr|A0A0F7N856|A0A0F7N856_9ACTN Uncharacterized protein OS=Streptomyces sp. CNQ-509 OX=444103 GN=AA958_17035 PE=3 SV=1
MM1 pKa = 7.95WINPNNGFGFACTTCSTTTYY21 pKa = 9.57EE22 pKa = 4.13RR23 pKa = 11.84QEE25 pKa = 3.88MTVLEE30 pKa = 4.35EE31 pKa = 4.63TNNHH35 pKa = 5.13WKK37 pKa = 8.87TGAKK41 pKa = 9.74QILAVGDD48 pKa = 3.38VDD50 pKa = 5.74GPLDD54 pKa = 3.79TDD56 pKa = 4.33DD57 pKa = 5.75DD58 pKa = 4.99GEE60 pKa = 5.19IDD62 pKa = 3.73TPGYY66 pKa = 9.83PDD68 pKa = 5.01LLVNDD73 pKa = 5.11GQHH76 pKa = 5.21LWLYY80 pKa = 10.23YY81 pKa = 10.53GDD83 pKa = 4.65PGGSAYY89 pKa = 10.83LDD91 pKa = 3.52AFRR94 pKa = 11.84DD95 pKa = 4.01PVLLAAGDD103 pKa = 4.0GMSTGTNTLANVTMAAPGDD122 pKa = 3.89FDD124 pKa = 6.34ADD126 pKa = 3.28GHH128 pKa = 6.84ADD130 pKa = 3.36LTVRR134 pKa = 11.84FDD136 pKa = 3.74NDD138 pKa = 3.16GSGLFLYY145 pKa = 10.51DD146 pKa = 5.39AINPDD151 pKa = 3.26ASTWPGQIDD160 pKa = 3.59PTHH163 pKa = 7.26RR164 pKa = 11.84ILIANNFGPNTVPMLTAAPDD184 pKa = 3.62ANNNGTFDD192 pKa = 4.02LWTTTPNSGRR202 pKa = 11.84LRR204 pKa = 11.84FFADD208 pKa = 4.56FTPDD212 pKa = 3.05GPVAITVASEE222 pKa = 3.63QFANYY227 pKa = 8.82QALGG231 pKa = 3.47
MM1 pKa = 7.95WINPNNGFGFACTTCSTTTYY21 pKa = 9.57EE22 pKa = 4.13RR23 pKa = 11.84QEE25 pKa = 3.88MTVLEE30 pKa = 4.35EE31 pKa = 4.63TNNHH35 pKa = 5.13WKK37 pKa = 8.87TGAKK41 pKa = 9.74QILAVGDD48 pKa = 3.38VDD50 pKa = 5.74GPLDD54 pKa = 3.79TDD56 pKa = 4.33DD57 pKa = 5.75DD58 pKa = 4.99GEE60 pKa = 5.19IDD62 pKa = 3.73TPGYY66 pKa = 9.83PDD68 pKa = 5.01LLVNDD73 pKa = 5.11GQHH76 pKa = 5.21LWLYY80 pKa = 10.23YY81 pKa = 10.53GDD83 pKa = 4.65PGGSAYY89 pKa = 10.83LDD91 pKa = 3.52AFRR94 pKa = 11.84DD95 pKa = 4.01PVLLAAGDD103 pKa = 4.0GMSTGTNTLANVTMAAPGDD122 pKa = 3.89FDD124 pKa = 6.34ADD126 pKa = 3.28GHH128 pKa = 6.84ADD130 pKa = 3.36LTVRR134 pKa = 11.84FDD136 pKa = 3.74NDD138 pKa = 3.16GSGLFLYY145 pKa = 10.51DD146 pKa = 5.39AINPDD151 pKa = 3.26ASTWPGQIDD160 pKa = 3.59PTHH163 pKa = 7.26RR164 pKa = 11.84ILIANNFGPNTVPMLTAAPDD184 pKa = 3.62ANNNGTFDD192 pKa = 4.02LWTTTPNSGRR202 pKa = 11.84LRR204 pKa = 11.84FFADD208 pKa = 4.56FTPDD212 pKa = 3.05GPVAITVASEE222 pKa = 3.63QFANYY227 pKa = 8.82QALGG231 pKa = 3.47
Molecular weight: 24.79 kDa
Isoelectric point according different methods:
Protein with the highest isoelectric point:
>tr|A0A0F7N7Z8|A0A0F7N7Z8_9ACTN Probable M18 family aminopeptidase 2 OS=Streptomyces sp. CNQ-509 OX=444103 GN=apeB PE=3 SV=1
MM1 pKa = 7.69SKK3 pKa = 9.0RR4 pKa = 11.84TFQPNNRR11 pKa = 11.84KK12 pKa = 8.98RR13 pKa = 11.84AKK15 pKa = 8.46THH17 pKa = 5.11GFRR20 pKa = 11.84LRR22 pKa = 11.84MRR24 pKa = 11.84TRR26 pKa = 11.84AGRR29 pKa = 11.84AIITARR35 pKa = 11.84RR36 pKa = 11.84TKK38 pKa = 10.43GRR40 pKa = 11.84ARR42 pKa = 11.84LSAA45 pKa = 3.91
MM1 pKa = 7.69SKK3 pKa = 9.0RR4 pKa = 11.84TFQPNNRR11 pKa = 11.84KK12 pKa = 8.98RR13 pKa = 11.84AKK15 pKa = 8.46THH17 pKa = 5.11GFRR20 pKa = 11.84LRR22 pKa = 11.84MRR24 pKa = 11.84TRR26 pKa = 11.84AGRR29 pKa = 11.84AIITARR35 pKa = 11.84RR36 pKa = 11.84TKK38 pKa = 10.43GRR40 pKa = 11.84ARR42 pKa = 11.84LSAA45 pKa = 3.91
Molecular weight: 5.28 kDa
Isoelectric point according different methods:
Peptides (in silico digests for buttom-up proteomics)
Below you can find in silico digests of the whole proteome with Trypsin, Chymotrypsin, Trypsin+LysC, LysN, ArgC proteases suitable for different mass spec machines.| Try ESI |
 |
|---|
| ChTry ESI |
 |
|---|
| ArgC ESI |
 |
|---|
| LysN ESI |
 |
|---|
| TryLysC ESI |
 |
|---|
| Try MALDI |
 |
|---|
| ChTry MALDI |
 |
|---|
| ArgC MALDI |
 |
|---|
| LysN MALDI |
 |
|---|
| TryLysC MALDI |
 |
|---|
| Try LTQ |
 |
|---|
| ChTry LTQ |
 |
|---|
| ArgC LTQ |
 |
|---|
| LysN LTQ |
 |
|---|
| TryLysC LTQ |
 |
|---|
| Try MSlow |
 |
|---|
| ChTry MSlow |
 |
|---|
| ArgC MSlow |
 |
|---|
| LysN MSlow |
 |
|---|
| TryLysC MSlow |
 |
|---|
| Try MShigh |
 |
|---|
| ChTry MShigh |
 |
|---|
| ArgC MShigh |
 |
|---|
| LysN MShigh |
 |
|---|
| TryLysC MShigh |
 |
|---|
General Statistics
Number of major isoforms |
Number of additional isoforms |
Number of all proteins |
Number of amino acids |
Min. Seq. Length |
Max. Seq. Length |
Avg. Seq. Length |
Avg. Mol. Weight |
|---|---|---|---|---|---|---|---|
0 |
2181675 |
29 |
5986 |
342.7 |
36.49 |
Amino acid frequency
Ala |
Cys |
Asp |
Glu |
Phe |
Gly |
His |
Ile |
Lys |
Leu |
|---|---|---|---|---|---|---|---|---|---|
14.6 ± 0.052 | 0.745 ± 0.008 |
6.065 ± 0.025 | 5.872 ± 0.028 |
2.658 ± 0.017 | 10.001 ± 0.034 |
2.236 ± 0.02 | 2.882 ± 0.023 |
1.867 ± 0.025 | 10.199 ± 0.034 |
Met |
Asn |
Gln |
Pro |
Arg |
Ser |
Thr |
Val |
Trp |
Tyr |
|---|---|---|---|---|---|---|---|---|---|
1.696 ± 0.014 | 1.596 ± 0.015 |
6.353 ± 0.03 | 2.575 ± 0.017 |
8.311 ± 0.041 | 4.551 ± 0.021 |
5.878 ± 0.026 | 8.322 ± 0.027 |
1.476 ± 0.013 | 2.119 ± 0.013 |
Most of the basic statistics you can see at this page can be downloaded from this CSV file
Proteome-pI is available under Creative Commons Attribution-NoDerivs license, for more details see here
| Reference: Kozlowski LP. Proteome-pI 2.0: Proteome Isoelectric Point Database Update. Nucleic Acids Res. 2021, doi: 10.1093/nar/gkab944 | Contact: Lukasz P. Kozlowski |
