Ancrocorticia populi
Taxonomy: cellular organisms; Bacteria; Terrabacteria group; Actinobacteria; Actinomycetia; Actinomycetales; Actinomycetaceae; Ancrocorticia
Average proteome isoelectric point is 5.74
Get precalculated fractions of proteins

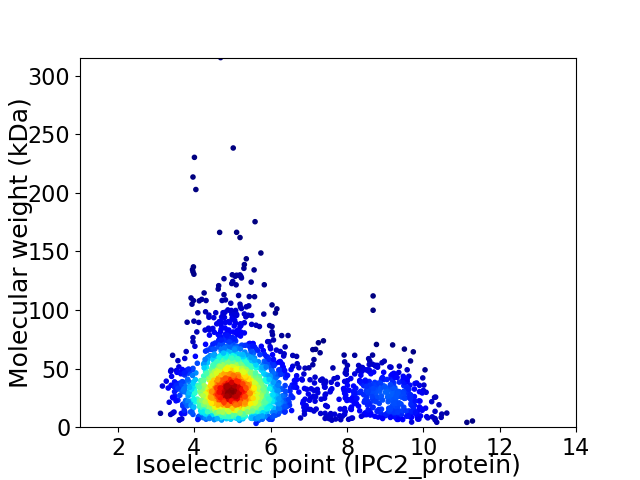
Virtual 2D-PAGE plot for 2288 proteins (isoelectric point calculated using IPC2_protein)
Get csv file with sequences according to given criteria:
* You can choose from 21 different methods for calculating isoelectric point
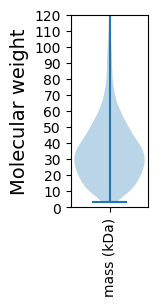
Summary statistics related to proteome-wise predictions


Protein with the lowest isoelectric point:
>tr|A0A2V1K690|A0A2V1K690_9ACTO HTH luxR-type domain-containing protein OS=Ancrocorticia populi OX=2175228 GN=DD236_08590 PE=4 SV=1
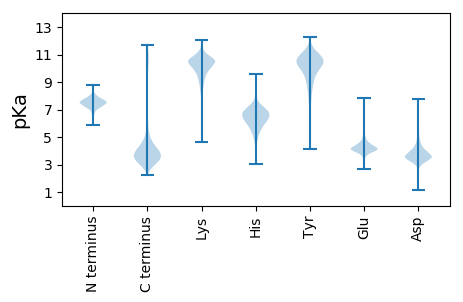
MM1 pKa = 7.56RR2 pKa = 11.84QNKK5 pKa = 9.87YY6 pKa = 10.32GVPAMAAAAALMLSACSSSGDD27 pKa = 3.92DD28 pKa = 3.82EE29 pKa = 5.84SSGGDD34 pKa = 3.18GGSGDD39 pKa = 4.18KK40 pKa = 10.14LTVGIKK46 pKa = 10.01FDD48 pKa = 3.76QPGLGLQKK56 pKa = 10.52GSEE59 pKa = 4.17YY60 pKa = 10.94SGFDD64 pKa = 2.96VDD66 pKa = 3.54VAYY69 pKa = 10.75YY70 pKa = 10.51VADD73 pKa = 3.62KK74 pKa = 11.01LGYY77 pKa = 10.05SQDD80 pKa = 3.19QVEE83 pKa = 4.93FVQSVTAQRR92 pKa = 11.84EE93 pKa = 4.28TMLEE97 pKa = 3.79NGQADD102 pKa = 4.55MIVATYY108 pKa = 10.02TMSDD112 pKa = 3.12ARR114 pKa = 11.84KK115 pKa = 8.58EE116 pKa = 4.21QIDD119 pKa = 3.55FAGPYY124 pKa = 9.62LVAGQSLLVAADD136 pKa = 4.32DD137 pKa = 4.37NSISGPDD144 pKa = 3.43NLDD147 pKa = 3.29GKK149 pKa = 10.03KK150 pKa = 10.08LCSVSGAVPAQRR162 pKa = 11.84IKK164 pKa = 11.16DD165 pKa = 3.73EE166 pKa = 4.27YY167 pKa = 11.33ASDD170 pKa = 3.72VQLYY174 pKa = 7.62EE175 pKa = 3.68ASTYY179 pKa = 9.48SEE181 pKa = 4.23CVEE184 pKa = 4.0LLGNGTIDD192 pKa = 4.97AVTTDD197 pKa = 3.76DD198 pKa = 5.67SILAGYY204 pKa = 9.43AAVPEE209 pKa = 4.04YY210 pKa = 10.56DD211 pKa = 3.6GKK213 pKa = 11.14FKK215 pKa = 11.12LVGEE219 pKa = 4.56AFSEE223 pKa = 4.42EE224 pKa = 4.66PYY226 pKa = 11.11GVGFPKK232 pKa = 10.71GSDD235 pKa = 2.83KK236 pKa = 11.36CEE238 pKa = 3.99PANEE242 pKa = 4.49ALTEE246 pKa = 4.2MIDD249 pKa = 4.35DD250 pKa = 4.64GSWDD254 pKa = 3.95QFLQDD259 pKa = 4.37NLGDD263 pKa = 4.22AYY265 pKa = 10.11TPDD268 pKa = 3.7ASLNPPEE275 pKa = 4.66VGGACSS281 pKa = 3.11
MM1 pKa = 7.56RR2 pKa = 11.84QNKK5 pKa = 9.87YY6 pKa = 10.32GVPAMAAAAALMLSACSSSGDD27 pKa = 3.92DD28 pKa = 3.82EE29 pKa = 5.84SSGGDD34 pKa = 3.18GGSGDD39 pKa = 4.18KK40 pKa = 10.14LTVGIKK46 pKa = 10.01FDD48 pKa = 3.76QPGLGLQKK56 pKa = 10.52GSEE59 pKa = 4.17YY60 pKa = 10.94SGFDD64 pKa = 2.96VDD66 pKa = 3.54VAYY69 pKa = 10.75YY70 pKa = 10.51VADD73 pKa = 3.62KK74 pKa = 11.01LGYY77 pKa = 10.05SQDD80 pKa = 3.19QVEE83 pKa = 4.93FVQSVTAQRR92 pKa = 11.84EE93 pKa = 4.28TMLEE97 pKa = 3.79NGQADD102 pKa = 4.55MIVATYY108 pKa = 10.02TMSDD112 pKa = 3.12ARR114 pKa = 11.84KK115 pKa = 8.58EE116 pKa = 4.21QIDD119 pKa = 3.55FAGPYY124 pKa = 9.62LVAGQSLLVAADD136 pKa = 4.32DD137 pKa = 4.37NSISGPDD144 pKa = 3.43NLDD147 pKa = 3.29GKK149 pKa = 10.03KK150 pKa = 10.08LCSVSGAVPAQRR162 pKa = 11.84IKK164 pKa = 11.16DD165 pKa = 3.73EE166 pKa = 4.27YY167 pKa = 11.33ASDD170 pKa = 3.72VQLYY174 pKa = 7.62EE175 pKa = 3.68ASTYY179 pKa = 9.48SEE181 pKa = 4.23CVEE184 pKa = 4.0LLGNGTIDD192 pKa = 4.97AVTTDD197 pKa = 3.76DD198 pKa = 5.67SILAGYY204 pKa = 9.43AAVPEE209 pKa = 4.04YY210 pKa = 10.56DD211 pKa = 3.6GKK213 pKa = 11.14FKK215 pKa = 11.12LVGEE219 pKa = 4.56AFSEE223 pKa = 4.42EE224 pKa = 4.66PYY226 pKa = 11.11GVGFPKK232 pKa = 10.71GSDD235 pKa = 2.83KK236 pKa = 11.36CEE238 pKa = 3.99PANEE242 pKa = 4.49ALTEE246 pKa = 4.2MIDD249 pKa = 4.35DD250 pKa = 4.64GSWDD254 pKa = 3.95QFLQDD259 pKa = 4.37NLGDD263 pKa = 4.22AYY265 pKa = 10.11TPDD268 pKa = 3.7ASLNPPEE275 pKa = 4.66VGGACSS281 pKa = 3.11
Molecular weight: 29.54 kDa
Isoelectric point according different methods:
Protein with the highest isoelectric point:
>tr|A0A2V1K631|A0A2V1K631_9ACTO GntR family transcriptional regulator OS=Ancrocorticia populi OX=2175228 GN=DD236_11495 PE=4 SV=1
MM1 pKa = 7.41VKK3 pKa = 9.03RR4 pKa = 11.84TFQPNNRR11 pKa = 11.84RR12 pKa = 11.84RR13 pKa = 11.84AKK15 pKa = 9.4VHH17 pKa = 5.57GFRR20 pKa = 11.84KK21 pKa = 10.13RR22 pKa = 11.84MGTRR26 pKa = 11.84AGRR29 pKa = 11.84AVLANRR35 pKa = 11.84RR36 pKa = 11.84RR37 pKa = 11.84KK38 pKa = 9.43GRR40 pKa = 11.84HH41 pKa = 4.95SLSAA45 pKa = 3.67
MM1 pKa = 7.41VKK3 pKa = 9.03RR4 pKa = 11.84TFQPNNRR11 pKa = 11.84RR12 pKa = 11.84RR13 pKa = 11.84AKK15 pKa = 9.4VHH17 pKa = 5.57GFRR20 pKa = 11.84KK21 pKa = 10.13RR22 pKa = 11.84MGTRR26 pKa = 11.84AGRR29 pKa = 11.84AVLANRR35 pKa = 11.84RR36 pKa = 11.84RR37 pKa = 11.84KK38 pKa = 9.43GRR40 pKa = 11.84HH41 pKa = 4.95SLSAA45 pKa = 3.67
Molecular weight: 5.29 kDa
Isoelectric point according different methods:
Peptides (in silico digests for buttom-up proteomics)
Below you can find in silico digests of the whole proteome with Trypsin, Chymotrypsin, Trypsin+LysC, LysN, ArgC proteases suitable for different mass spec machines.| Try ESI |
 |
|---|
| ChTry ESI |
 |
|---|
| ArgC ESI |
 |
|---|
| LysN ESI |
 |
|---|
| TryLysC ESI |
 |
|---|
| Try MALDI |
 |
|---|
| ChTry MALDI |
 |
|---|
| ArgC MALDI |
 |
|---|
| LysN MALDI |
 |
|---|
| TryLysC MALDI |
 |
|---|
| Try LTQ |
 |
|---|
| ChTry LTQ |
 |
|---|
| ArgC LTQ |
 |
|---|
| LysN LTQ |
 |
|---|
| TryLysC LTQ |
 |
|---|
| Try MSlow |
 |
|---|
| ChTry MSlow |
 |
|---|
| ArgC MSlow |
 |
|---|
| LysN MSlow |
 |
|---|
| TryLysC MSlow |
 |
|---|
| Try MShigh |
 |
|---|
| ChTry MShigh |
 |
|---|
| ArgC MShigh |
 |
|---|
| LysN MShigh |
 |
|---|
| TryLysC MShigh |
 |
|---|
General Statistics
Number of major isoforms |
Number of additional isoforms |
Number of all proteins |
Number of amino acids |
Min. Seq. Length |
Max. Seq. Length |
Avg. Seq. Length |
Avg. Mol. Weight |
|---|---|---|---|---|---|---|---|
0 |
792421 |
29 |
2979 |
346.3 |
37.44 |
Amino acid frequency
Ala |
Cys |
Asp |
Glu |
Phe |
Gly |
His |
Ile |
Lys |
Leu |
|---|---|---|---|---|---|---|---|---|---|
11.32 ± 0.055 | 0.752 ± 0.014 |
6.043 ± 0.047 | 6.531 ± 0.047 |
3.214 ± 0.031 | 8.697 ± 0.049 |
1.981 ± 0.022 | 5.301 ± 0.039 |
2.958 ± 0.034 | 9.613 ± 0.056 |
Met |
Asn |
Gln |
Pro |
Arg |
Ser |
Thr |
Val |
Trp |
Tyr |
|---|---|---|---|---|---|---|---|---|---|
2.286 ± 0.022 | 2.76 ± 0.029 |
4.913 ± 0.035 | 3.303 ± 0.033 |
6.069 ± 0.056 | 6.401 ± 0.036 |
5.946 ± 0.044 | 8.149 ± 0.045 |
1.415 ± 0.021 | 2.346 ± 0.023 |
Most of the basic statistics you can see at this page can be downloaded from this CSV file
Proteome-pI is available under Creative Commons Attribution-NoDerivs license, for more details see here
| Reference: Kozlowski LP. Proteome-pI 2.0: Proteome Isoelectric Point Database Update. Nucleic Acids Res. 2021, doi: 10.1093/nar/gkab944 | Contact: Lukasz P. Kozlowski |
