Deminuibacter soli
Taxonomy: cellular organisms; Bacteria; FCB group; Bacteroidetes/Chlorobi group; Bacteroidetes; Chitinophagia; Chitinophagales; Chitinophagaceae; Deminuibacter
Average proteome isoelectric point is 6.95
Get precalculated fractions of proteins

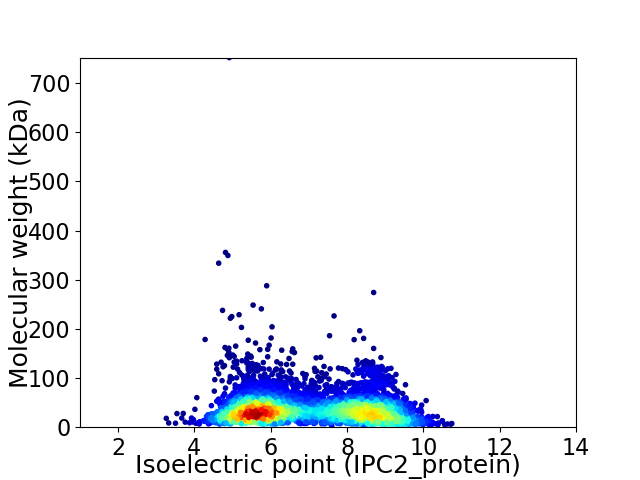
Virtual 2D-PAGE plot for 4790 proteins (isoelectric point calculated using IPC2_protein)
Get csv file with sequences according to given criteria:
* You can choose from 21 different methods for calculating isoelectric point
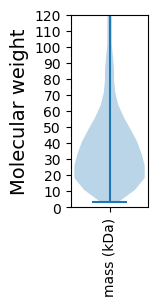
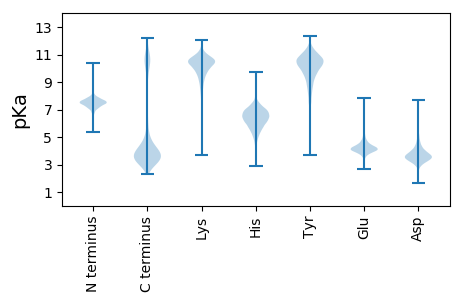
Summary statistics related to proteome-wise predictions


Protein with the lowest isoelectric point:
>tr|A0A3E1NER1|A0A3E1NER1_9BACT Cytochrome oxidase subunit I OS=Deminuibacter soli OX=2291815 GN=DXN05_19780 PE=4 SV=1
MM1 pKa = 8.12DD2 pKa = 3.9NQKK5 pKa = 10.76KK6 pKa = 10.36GGLPGTPKK14 pKa = 10.7DD15 pKa = 3.13RR16 pKa = 11.84LTFNKK21 pKa = 8.99TDD23 pKa = 3.44QYY25 pKa = 11.13IDD27 pKa = 3.07AAAPIDD33 pKa = 4.13LSHH36 pKa = 6.76GCVAILVDD44 pKa = 3.7VAADD48 pKa = 3.73VVTDD52 pKa = 4.02AATDD56 pKa = 3.54AVTDD60 pKa = 3.87AVVDD64 pKa = 4.77GVADD68 pKa = 3.85SAADD72 pKa = 3.61AAADD76 pKa = 3.86TAADD80 pKa = 3.72AAADD84 pKa = 3.98TAADD88 pKa = 3.87TAADD92 pKa = 3.62AAADD96 pKa = 3.72AGADD100 pKa = 3.39SGAQGGISTACSKK113 pKa = 10.53RR114 pKa = 11.84LKK116 pKa = 9.59TLAIMLGGAIMSTVTTAVANAIYY139 pKa = 10.38NAIKK143 pKa = 10.54SAGSTPTTSADD154 pKa = 3.08YY155 pKa = 7.7WTALYY160 pKa = 11.2NSMITVYY167 pKa = 10.36PCNANNASTCPGNQRR182 pKa = 11.84DD183 pKa = 3.88EE184 pKa = 4.34QEE186 pKa = 4.42AMVLSLQQQLAQTASYY202 pKa = 9.43AQSAQTFEE210 pKa = 4.7EE211 pKa = 4.5SWSAASQTQLKK222 pKa = 10.39DD223 pKa = 3.33SLITVTDD230 pKa = 3.39TGGIPSMCQYY240 pKa = 9.78MEE242 pKa = 4.61NYY244 pKa = 8.38TNTGASGAALVIATINVFDD263 pKa = 3.74TVAAYY268 pKa = 7.95EE269 pKa = 4.27YY270 pKa = 10.35PDD272 pKa = 3.47LTNN275 pKa = 3.73
MM1 pKa = 8.12DD2 pKa = 3.9NQKK5 pKa = 10.76KK6 pKa = 10.36GGLPGTPKK14 pKa = 10.7DD15 pKa = 3.13RR16 pKa = 11.84LTFNKK21 pKa = 8.99TDD23 pKa = 3.44QYY25 pKa = 11.13IDD27 pKa = 3.07AAAPIDD33 pKa = 4.13LSHH36 pKa = 6.76GCVAILVDD44 pKa = 3.7VAADD48 pKa = 3.73VVTDD52 pKa = 4.02AATDD56 pKa = 3.54AVTDD60 pKa = 3.87AVVDD64 pKa = 4.77GVADD68 pKa = 3.85SAADD72 pKa = 3.61AAADD76 pKa = 3.86TAADD80 pKa = 3.72AAADD84 pKa = 3.98TAADD88 pKa = 3.87TAADD92 pKa = 3.62AAADD96 pKa = 3.72AGADD100 pKa = 3.39SGAQGGISTACSKK113 pKa = 10.53RR114 pKa = 11.84LKK116 pKa = 9.59TLAIMLGGAIMSTVTTAVANAIYY139 pKa = 10.38NAIKK143 pKa = 10.54SAGSTPTTSADD154 pKa = 3.08YY155 pKa = 7.7WTALYY160 pKa = 11.2NSMITVYY167 pKa = 10.36PCNANNASTCPGNQRR182 pKa = 11.84DD183 pKa = 3.88EE184 pKa = 4.34QEE186 pKa = 4.42AMVLSLQQQLAQTASYY202 pKa = 9.43AQSAQTFEE210 pKa = 4.7EE211 pKa = 4.5SWSAASQTQLKK222 pKa = 10.39DD223 pKa = 3.33SLITVTDD230 pKa = 3.39TGGIPSMCQYY240 pKa = 9.78MEE242 pKa = 4.61NYY244 pKa = 8.38TNTGASGAALVIATINVFDD263 pKa = 3.74TVAAYY268 pKa = 7.95EE269 pKa = 4.27YY270 pKa = 10.35PDD272 pKa = 3.47LTNN275 pKa = 3.73
Molecular weight: 28.03 kDa
Isoelectric point according different methods:
Protein with the highest isoelectric point:
>tr|A0A3E1NJ30|A0A3E1NJ30_9BACT Uncharacterized protein OS=Deminuibacter soli OX=2291815 GN=DXN05_10350 PE=4 SV=1
MM1 pKa = 7.17TKK3 pKa = 9.84WLFTEE8 pKa = 4.15IDD10 pKa = 3.25TAIILRR16 pKa = 11.84VHH18 pKa = 6.61QIQSGMPGQQPINSVLVYY36 pKa = 9.46TCLLSGVQWFSVNTFEE52 pKa = 5.39TRR54 pKa = 11.84DD55 pKa = 3.29RR56 pKa = 11.84MEE58 pKa = 4.6GIRR61 pKa = 11.84RR62 pKa = 11.84EE63 pKa = 3.98RR64 pKa = 11.84LKK66 pKa = 10.81LVCFVRR72 pKa = 11.84RR73 pKa = 11.84NKK75 pKa = 9.93VAIVLRR81 pKa = 11.84KK82 pKa = 6.09MTSEE86 pKa = 3.48IRR88 pKa = 11.84ILFF91 pKa = 3.99
MM1 pKa = 7.17TKK3 pKa = 9.84WLFTEE8 pKa = 4.15IDD10 pKa = 3.25TAIILRR16 pKa = 11.84VHH18 pKa = 6.61QIQSGMPGQQPINSVLVYY36 pKa = 9.46TCLLSGVQWFSVNTFEE52 pKa = 5.39TRR54 pKa = 11.84DD55 pKa = 3.29RR56 pKa = 11.84MEE58 pKa = 4.6GIRR61 pKa = 11.84RR62 pKa = 11.84EE63 pKa = 3.98RR64 pKa = 11.84LKK66 pKa = 10.81LVCFVRR72 pKa = 11.84RR73 pKa = 11.84NKK75 pKa = 9.93VAIVLRR81 pKa = 11.84KK82 pKa = 6.09MTSEE86 pKa = 3.48IRR88 pKa = 11.84ILFF91 pKa = 3.99
Molecular weight: 10.73 kDa
Isoelectric point according different methods:
Peptides (in silico digests for buttom-up proteomics)
Below you can find in silico digests of the whole proteome with Trypsin, Chymotrypsin, Trypsin+LysC, LysN, ArgC proteases suitable for different mass spec machines.| Try ESI |
 |
|---|
| ChTry ESI |
 |
|---|
| ArgC ESI |
 |
|---|
| LysN ESI |
 |
|---|
| TryLysC ESI |
 |
|---|
| Try MALDI |
 |
|---|
| ChTry MALDI |
 |
|---|
| ArgC MALDI |
 |
|---|
| LysN MALDI |
 |
|---|
| TryLysC MALDI |
 |
|---|
| Try LTQ |
 |
|---|
| ChTry LTQ |
 |
|---|
| ArgC LTQ |
 |
|---|
| LysN LTQ |
 |
|---|
| TryLysC LTQ |
 |
|---|
| Try MSlow |
 |
|---|
| ChTry MSlow |
 |
|---|
| ArgC MSlow |
 |
|---|
| LysN MSlow |
 |
|---|
| TryLysC MSlow |
 |
|---|
| Try MShigh |
 |
|---|
| ChTry MShigh |
 |
|---|
| ArgC MShigh |
 |
|---|
| LysN MShigh |
 |
|---|
| TryLysC MShigh |
 |
|---|
General Statistics
Number of major isoforms |
Number of additional isoforms |
Number of all proteins |
Number of amino acids |
Min. Seq. Length |
Max. Seq. Length |
Avg. Seq. Length |
Avg. Mol. Weight |
|---|---|---|---|---|---|---|---|
0 |
1704224 |
26 |
7259 |
355.8 |
39.66 |
Amino acid frequency
Ala |
Cys |
Asp |
Glu |
Phe |
Gly |
His |
Ile |
Lys |
Leu |
|---|---|---|---|---|---|---|---|---|---|
8.818 ± 0.042 | 0.911 ± 0.013 |
5.075 ± 0.022 | 4.946 ± 0.038 |
4.589 ± 0.029 | 7.026 ± 0.039 |
2.189 ± 0.02 | 6.269 ± 0.027 |
5.909 ± 0.035 | 9.53 ± 0.045 |
Met |
Asn |
Gln |
Pro |
Arg |
Ser |
Thr |
Val |
Trp |
Tyr |
|---|---|---|---|---|---|---|---|---|---|
2.316 ± 0.017 | 5.287 ± 0.037 |
4.128 ± 0.028 | 4.547 ± 0.026 |
4.222 ± 0.025 | 5.901 ± 0.032 |
6.194 ± 0.049 | 6.652 ± 0.035 |
1.316 ± 0.014 | 4.172 ± 0.024 |
Most of the basic statistics you can see at this page can be downloaded from this CSV file
Proteome-pI is available under Creative Commons Attribution-NoDerivs license, for more details see here
| Reference: Kozlowski LP. Proteome-pI 2.0: Proteome Isoelectric Point Database Update. Nucleic Acids Res. 2021, doi: 10.1093/nar/gkab944 | Contact: Lukasz P. Kozlowski |
