Halorubrum distributum
Taxonomy: cellular organisms
Average proteome isoelectric point is 4.93
Get precalculated fractions of proteins

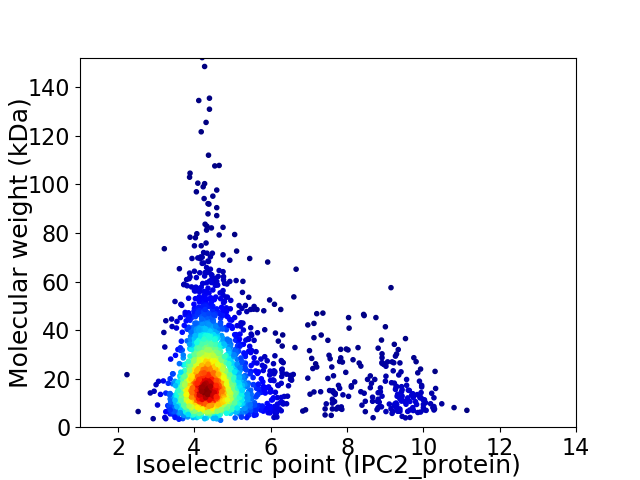
Virtual 2D-PAGE plot for 2492 proteins (isoelectric point calculated using IPC2_protein)
Get csv file with sequences according to given criteria:
* You can choose from 21 different methods for calculating isoelectric point
Summary statistics related to proteome-wise predictions


Protein with the lowest isoelectric point:
>tr|A0A256KYM2|A0A256KYM2_9EURY Transcriptional regulator OS=Halorubrum distributum OX=29283 GN=DJ72_02835 PE=4 SV=1
MM1 pKa = 7.06FVEE4 pKa = 4.98HH5 pKa = 6.87LPDD8 pKa = 4.9DD9 pKa = 4.29RR10 pKa = 11.84GQAHH14 pKa = 5.8TLEE17 pKa = 4.85AFTAALLLVTGLIFATQATAVTPLSASTSNQHH49 pKa = 5.85VEE51 pKa = 4.11NQASIAAQDD60 pKa = 4.15LLSTTDD66 pKa = 3.19ASGTLSAALLYY77 pKa = 10.21YY78 pKa = 10.84DD79 pKa = 3.98NGSFVGATDD88 pKa = 3.44EE89 pKa = 4.14EE90 pKa = 6.07GYY92 pKa = 11.33AGMPPDD98 pKa = 4.03SHH100 pKa = 7.03PLHH103 pKa = 7.37DD104 pKa = 5.25PLTEE108 pKa = 4.02AFGDD112 pKa = 3.66RR113 pKa = 11.84QIAFDD118 pKa = 3.7IDD120 pKa = 3.67VYY122 pKa = 11.61YY123 pKa = 10.25PDD125 pKa = 5.52DD126 pKa = 4.72SSDD129 pKa = 3.48GTGDD133 pKa = 3.2VAMVDD138 pKa = 3.66MGPPSDD144 pKa = 3.96NAATASIRR152 pKa = 11.84VTLYY156 pKa = 10.48GDD158 pKa = 3.65DD159 pKa = 4.03RR160 pKa = 11.84FGADD164 pKa = 3.76DD165 pKa = 3.55QHH167 pKa = 8.2VLAEE171 pKa = 4.77DD172 pKa = 4.41GPGRR176 pKa = 11.84GYY178 pKa = 10.65FADD181 pKa = 3.94PVDD184 pKa = 4.07GNGEE188 pKa = 3.67ILYY191 pKa = 8.84TVVEE195 pKa = 4.18VRR197 pKa = 11.84ITAWQMM203 pKa = 2.84
MM1 pKa = 7.06FVEE4 pKa = 4.98HH5 pKa = 6.87LPDD8 pKa = 4.9DD9 pKa = 4.29RR10 pKa = 11.84GQAHH14 pKa = 5.8TLEE17 pKa = 4.85AFTAALLLVTGLIFATQATAVTPLSASTSNQHH49 pKa = 5.85VEE51 pKa = 4.11NQASIAAQDD60 pKa = 4.15LLSTTDD66 pKa = 3.19ASGTLSAALLYY77 pKa = 10.21YY78 pKa = 10.84DD79 pKa = 3.98NGSFVGATDD88 pKa = 3.44EE89 pKa = 4.14EE90 pKa = 6.07GYY92 pKa = 11.33AGMPPDD98 pKa = 4.03SHH100 pKa = 7.03PLHH103 pKa = 7.37DD104 pKa = 5.25PLTEE108 pKa = 4.02AFGDD112 pKa = 3.66RR113 pKa = 11.84QIAFDD118 pKa = 3.7IDD120 pKa = 3.67VYY122 pKa = 11.61YY123 pKa = 10.25PDD125 pKa = 5.52DD126 pKa = 4.72SSDD129 pKa = 3.48GTGDD133 pKa = 3.2VAMVDD138 pKa = 3.66MGPPSDD144 pKa = 3.96NAATASIRR152 pKa = 11.84VTLYY156 pKa = 10.48GDD158 pKa = 3.65DD159 pKa = 4.03RR160 pKa = 11.84FGADD164 pKa = 3.76DD165 pKa = 3.55QHH167 pKa = 8.2VLAEE171 pKa = 4.77DD172 pKa = 4.41GPGRR176 pKa = 11.84GYY178 pKa = 10.65FADD181 pKa = 3.94PVDD184 pKa = 4.07GNGEE188 pKa = 3.67ILYY191 pKa = 8.84TVVEE195 pKa = 4.18VRR197 pKa = 11.84ITAWQMM203 pKa = 2.84
Molecular weight: 21.52 kDa
Isoelectric point according different methods:
Protein with the highest isoelectric point:
>tr|A0A256KJB9|A0A256KJB9_9EURY Shikimate_DH domain-containing protein (Fragment) OS=Halorubrum distributum OX=29283 GN=DJ72_11260 PE=4 SV=1
MM1 pKa = 7.34NANSSVPYY9 pKa = 9.38SASRR13 pKa = 11.84STPRR17 pKa = 11.84RR18 pKa = 11.84WPSTRR23 pKa = 11.84PHH25 pKa = 5.63RR26 pKa = 11.84RR27 pKa = 11.84FRR29 pKa = 11.84RR30 pKa = 11.84AIGRR34 pKa = 11.84RR35 pKa = 11.84RR36 pKa = 11.84SARR39 pKa = 11.84SGTPTTTLTATWPAPSPSVGTPPTT63 pKa = 3.57
MM1 pKa = 7.34NANSSVPYY9 pKa = 9.38SASRR13 pKa = 11.84STPRR17 pKa = 11.84RR18 pKa = 11.84WPSTRR23 pKa = 11.84PHH25 pKa = 5.63RR26 pKa = 11.84RR27 pKa = 11.84FRR29 pKa = 11.84RR30 pKa = 11.84AIGRR34 pKa = 11.84RR35 pKa = 11.84RR36 pKa = 11.84SARR39 pKa = 11.84SGTPTTTLTATWPAPSPSVGTPPTT63 pKa = 3.57
Molecular weight: 6.95 kDa
Isoelectric point according different methods:
Peptides (in silico digests for buttom-up proteomics)
Below you can find in silico digests of the whole proteome with Trypsin, Chymotrypsin, Trypsin+LysC, LysN, ArgC proteases suitable for different mass spec machines.| Try ESI |
 |
|---|
| ChTry ESI |
 |
|---|
| ArgC ESI |
 |
|---|
| LysN ESI |
 |
|---|
| TryLysC ESI |
 |
|---|
| Try MALDI |
 |
|---|
| ChTry MALDI |
 |
|---|
| ArgC MALDI |
 |
|---|
| LysN MALDI |
 |
|---|
| TryLysC MALDI |
 |
|---|
| Try LTQ |
 |
|---|
| ChTry LTQ |
 |
|---|
| ArgC LTQ |
 |
|---|
| LysN LTQ |
 |
|---|
| TryLysC LTQ |
 |
|---|
| Try MSlow |
 |
|---|
| ChTry MSlow |
 |
|---|
| ArgC MSlow |
 |
|---|
| LysN MSlow |
 |
|---|
| TryLysC MSlow |
 |
|---|
| Try MShigh |
 |
|---|
| ChTry MShigh |
 |
|---|
| ArgC MShigh |
 |
|---|
| LysN MShigh |
 |
|---|
| TryLysC MShigh |
 |
|---|
General Statistics
Number of major isoforms |
Number of additional isoforms |
Number of all proteins |
Number of amino acids |
Min. Seq. Length |
Max. Seq. Length |
Avg. Seq. Length |
Avg. Mol. Weight |
|---|---|---|---|---|---|---|---|
0 |
532659 |
27 |
1342 |
213.7 |
23.22 |
Amino acid frequency
Ala |
Cys |
Asp |
Glu |
Phe |
Gly |
His |
Ile |
Lys |
Leu |
|---|---|---|---|---|---|---|---|---|---|
11.166 ± 0.087 | 0.682 ± 0.017 |
8.777 ± 0.068 | 8.605 ± 0.063 |
3.338 ± 0.04 | 8.693 ± 0.06 |
1.922 ± 0.027 | 3.989 ± 0.038 |
1.908 ± 0.035 | 8.671 ± 0.062 |
Met |
Asn |
Gln |
Pro |
Arg |
Ser |
Thr |
Val |
Trp |
Tyr |
|---|---|---|---|---|---|---|---|---|---|
1.712 ± 0.027 | 2.328 ± 0.03 |
4.726 ± 0.035 | 2.337 ± 0.04 |
6.744 ± 0.053 | 5.425 ± 0.044 |
6.152 ± 0.041 | 8.976 ± 0.06 |
1.139 ± 0.023 | 2.71 ± 0.028 |
Most of the basic statistics you can see at this page can be downloaded from this CSV file
Proteome-pI is available under Creative Commons Attribution-NoDerivs license, for more details see here
| Reference: Kozlowski LP. Proteome-pI 2.0: Proteome Isoelectric Point Database Update. Nucleic Acids Res. 2021, doi: 10.1093/nar/gkab944 | Contact: Lukasz P. Kozlowski |
