Gordonia phage Tanis
Taxonomy: Viruses; Duplodnaviria; Heunggongvirae; Uroviricota; Caudoviricetes; Caudovirales; Siphoviridae; Deejayvirinae; Tanisvirus; Gordonia virus Tanis
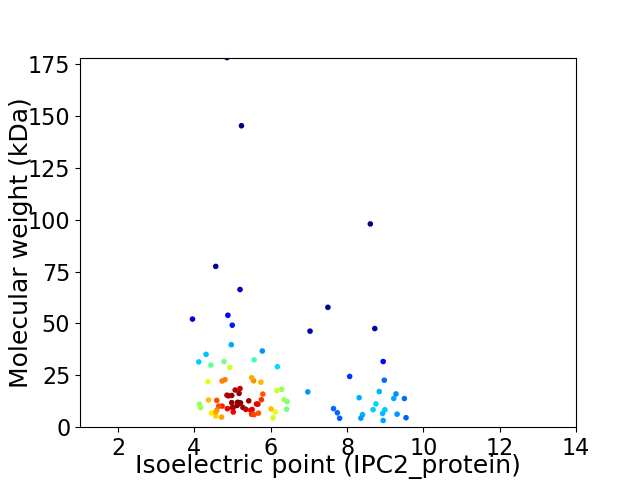
Average proteome isoelectric point is 6.06
Get precalculated fractions of proteins

Virtual 2D-PAGE plot for 93 proteins (isoelectric point calculated using IPC2_protein)
Get csv file with sequences according to given criteria:
* You can choose from 21 different methods for calculating isoelectric point
Summary statistics related to proteome-wise predictions


Protein with the lowest isoelectric point:
>tr|A0A5P8D9C0|A0A5P8D9C0_9CAUD Uncharacterized protein OS=Gordonia phage Tanis OX=2652415 GN=33 PE=4 SV=1
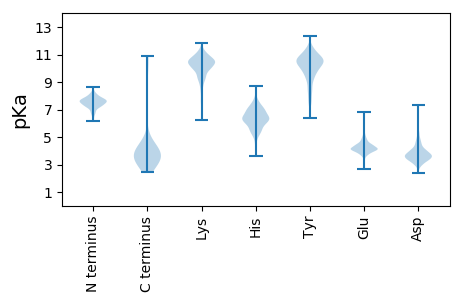
MM1 pKa = 7.8SEE3 pKa = 4.86LKK5 pKa = 9.67WDD7 pKa = 3.72SAGEE11 pKa = 3.92RR12 pKa = 11.84LYY14 pKa = 10.32EE15 pKa = 4.01TGVDD19 pKa = 3.47HH20 pKa = 6.95GVLYY24 pKa = 10.55IPDD27 pKa = 3.57NMGEE31 pKa = 4.09YY32 pKa = 10.64SNGYY36 pKa = 8.4AWNGLTSVSEE46 pKa = 4.39SPSGAEE52 pKa = 4.81SNPQYY57 pKa = 11.32ADD59 pKa = 3.31NIKK62 pKa = 10.1YY63 pKa = 10.68LNLISAEE70 pKa = 4.05EE71 pKa = 3.95FGATIEE77 pKa = 4.25AFTYY81 pKa = 10.1PDD83 pKa = 4.39EE84 pKa = 5.31FSQCDD89 pKa = 3.55GTALIGGVQIAQQTRR104 pKa = 11.84KK105 pKa = 10.29SFGFSYY111 pKa = 9.38RR112 pKa = 11.84TLIGNDD118 pKa = 3.28LVGTDD123 pKa = 4.08FGYY126 pKa = 10.58KK127 pKa = 8.59IHH129 pKa = 7.01LVYY132 pKa = 10.66GCQAAPSEE140 pKa = 4.53KK141 pKa = 10.27SRR143 pKa = 11.84STVNDD148 pKa = 3.36SPEE151 pKa = 3.65AATFSWEE158 pKa = 4.0LTTNPVPVAGINADD172 pKa = 3.16TGKK175 pKa = 9.83PYY177 pKa = 10.75RR178 pKa = 11.84PTAHH182 pKa = 5.59VTVDD186 pKa = 3.47STKK189 pKa = 10.35VSASALAALEE199 pKa = 4.44EE200 pKa = 4.31ILYY203 pKa = 8.44GTASEE208 pKa = 4.65DD209 pKa = 3.45PRR211 pKa = 11.84MPAPEE216 pKa = 4.16EE217 pKa = 3.85VLEE220 pKa = 4.17LVGDD224 pKa = 4.34ALTEE228 pKa = 4.14VTPMAATFDD237 pKa = 4.13APSDD241 pKa = 3.82TVTIPSQAGVVYY253 pKa = 10.48KK254 pKa = 10.54IGGVPVVAGDD264 pKa = 3.54RR265 pKa = 11.84VITVEE270 pKa = 4.13TTVMAEE276 pKa = 3.72AAIGYY281 pKa = 7.18SFPDD285 pKa = 3.68GVTTSWTFDD294 pKa = 3.54PAA296 pKa = 3.86
MM1 pKa = 7.8SEE3 pKa = 4.86LKK5 pKa = 9.67WDD7 pKa = 3.72SAGEE11 pKa = 3.92RR12 pKa = 11.84LYY14 pKa = 10.32EE15 pKa = 4.01TGVDD19 pKa = 3.47HH20 pKa = 6.95GVLYY24 pKa = 10.55IPDD27 pKa = 3.57NMGEE31 pKa = 4.09YY32 pKa = 10.64SNGYY36 pKa = 8.4AWNGLTSVSEE46 pKa = 4.39SPSGAEE52 pKa = 4.81SNPQYY57 pKa = 11.32ADD59 pKa = 3.31NIKK62 pKa = 10.1YY63 pKa = 10.68LNLISAEE70 pKa = 4.05EE71 pKa = 3.95FGATIEE77 pKa = 4.25AFTYY81 pKa = 10.1PDD83 pKa = 4.39EE84 pKa = 5.31FSQCDD89 pKa = 3.55GTALIGGVQIAQQTRR104 pKa = 11.84KK105 pKa = 10.29SFGFSYY111 pKa = 9.38RR112 pKa = 11.84TLIGNDD118 pKa = 3.28LVGTDD123 pKa = 4.08FGYY126 pKa = 10.58KK127 pKa = 8.59IHH129 pKa = 7.01LVYY132 pKa = 10.66GCQAAPSEE140 pKa = 4.53KK141 pKa = 10.27SRR143 pKa = 11.84STVNDD148 pKa = 3.36SPEE151 pKa = 3.65AATFSWEE158 pKa = 4.0LTTNPVPVAGINADD172 pKa = 3.16TGKK175 pKa = 9.83PYY177 pKa = 10.75RR178 pKa = 11.84PTAHH182 pKa = 5.59VTVDD186 pKa = 3.47STKK189 pKa = 10.35VSASALAALEE199 pKa = 4.44EE200 pKa = 4.31ILYY203 pKa = 8.44GTASEE208 pKa = 4.65DD209 pKa = 3.45PRR211 pKa = 11.84MPAPEE216 pKa = 4.16EE217 pKa = 3.85VLEE220 pKa = 4.17LVGDD224 pKa = 4.34ALTEE228 pKa = 4.14VTPMAATFDD237 pKa = 4.13APSDD241 pKa = 3.82TVTIPSQAGVVYY253 pKa = 10.48KK254 pKa = 10.54IGGVPVVAGDD264 pKa = 3.54RR265 pKa = 11.84VITVEE270 pKa = 4.13TTVMAEE276 pKa = 3.72AAIGYY281 pKa = 7.18SFPDD285 pKa = 3.68GVTTSWTFDD294 pKa = 3.54PAA296 pKa = 3.86
Molecular weight: 31.46 kDa
Isoelectric point according different methods:
Protein with the highest isoelectric point:
>tr|A0A5P8DC03|A0A5P8DC03_9CAUD Uncharacterized protein OS=Gordonia phage Tanis OX=2652415 GN=86 PE=4 SV=1
MM1 pKa = 7.69ASNKK5 pKa = 9.61RR6 pKa = 11.84KK7 pKa = 9.84YY8 pKa = 10.88GLFNFIVDD16 pKa = 3.62ITLSLLTGGLWLIWIFCRR34 pKa = 11.84EE35 pKa = 3.77MRR37 pKa = 11.84RR38 pKa = 3.48
MM1 pKa = 7.69ASNKK5 pKa = 9.61RR6 pKa = 11.84KK7 pKa = 9.84YY8 pKa = 10.88GLFNFIVDD16 pKa = 3.62ITLSLLTGGLWLIWIFCRR34 pKa = 11.84EE35 pKa = 3.77MRR37 pKa = 11.84RR38 pKa = 3.48
Molecular weight: 4.56 kDa
Isoelectric point according different methods:
Peptides (in silico digests for buttom-up proteomics)
Below you can find in silico digests of the whole proteome with Trypsin, Chymotrypsin, Trypsin+LysC, LysN, ArgC proteases suitable for different mass spec machines.| Try ESI |
 |
|---|
| ChTry ESI |
 |
|---|
| ArgC ESI |
 |
|---|
| LysN ESI |
 |
|---|
| TryLysC ESI |
 |
|---|
| Try MALDI |
 |
|---|
| ChTry MALDI |
 |
|---|
| ArgC MALDI |
 |
|---|
| LysN MALDI |
 |
|---|
| TryLysC MALDI |
 |
|---|
| Try LTQ |
 |
|---|
| ChTry LTQ |
 |
|---|
| ArgC LTQ |
 |
|---|
| LysN LTQ |
 |
|---|
| TryLysC LTQ |
 |
|---|
| Try MSlow |
 |
|---|
| ChTry MSlow |
 |
|---|
| ArgC MSlow |
 |
|---|
| LysN MSlow |
 |
|---|
| TryLysC MSlow |
 |
|---|
| Try MShigh |
 |
|---|
| ChTry MShigh |
 |
|---|
| ArgC MShigh |
 |
|---|
| LysN MShigh |
 |
|---|
| TryLysC MShigh |
 |
|---|
General Statistics
Number of major isoforms |
Number of additional isoforms |
Number of all proteins |
Number of amino acids |
Min. Seq. Length |
Max. Seq. Length |
Avg. Seq. Length |
Avg. Mol. Weight |
|---|---|---|---|---|---|---|---|
0 |
18493 |
30 |
1704 |
198.8 |
22.06 |
Amino acid frequency
Ala |
Cys |
Asp |
Glu |
Phe |
Gly |
His |
Ile |
Lys |
Leu |
|---|---|---|---|---|---|---|---|---|---|
8.598 ± 0.494 | 0.6 ± 0.088 |
6.289 ± 0.264 | 7.046 ± 0.395 |
3.553 ± 0.237 | 7.3 ± 0.43 |
1.903 ± 0.21 | 5.927 ± 0.275 |
5.889 ± 0.318 | 8.095 ± 0.352 |
Met |
Asn |
Gln |
Pro |
Arg |
Ser |
Thr |
Val |
Trp |
Tyr |
|---|---|---|---|---|---|---|---|---|---|
2.828 ± 0.17 | 4.472 ± 0.162 |
3.974 ± 0.233 | 3.45 ± 0.166 |
4.948 ± 0.302 | 6.7 ± 0.23 |
6.3 ± 0.253 | 7.408 ± 0.238 |
1.314 ± 0.096 | 3.407 ± 0.284 |
Most of the basic statistics you can see at this page can be downloaded from this CSV file
Proteome-pI is available under Creative Commons Attribution-NoDerivs license, for more details see here
| Reference: Kozlowski LP. Proteome-pI 2.0: Proteome Isoelectric Point Database Update. Nucleic Acids Res. 2021, doi: 10.1093/nar/gkab944 | Contact: Lukasz P. Kozlowski |
