Aspergillus turcosus
Taxonomy: cellular organisms; Eukaryota; Opisthokonta; Fungi; Dikarya; Ascomycota; saccharomyceta; Pezizomycotina; leotiomyceta; Eurotiomycetes; Eurotiomycetidae; Eurotiales; Aspergillaceae; Aspergillus
Average proteome isoelectric point is 6.38
Get precalculated fractions of proteins

Virtual 2D-PAGE plot for 9174 proteins (isoelectric point calculated using IPC2_protein)
Get csv file with sequences according to given criteria:
* You can choose from 21 different methods for calculating isoelectric point
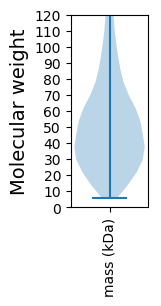
Summary statistics related to proteome-wise predictions


Protein with the lowest isoelectric point:
>tr|A0A421CTZ5|A0A421CTZ5_9EURO Anaphase-promoting complex subunit 2 OS=Aspergillus turcosus OX=1245748 GN=CFD26_101979 PE=3 SV=1
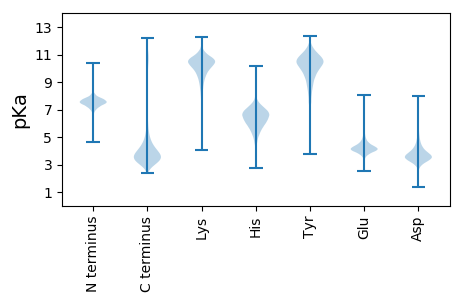
MM1 pKa = 7.91PIKK4 pKa = 10.63LSTILSSLFYY14 pKa = 10.87LLPLYY19 pKa = 10.78LFVLAPLLRR28 pKa = 11.84QFFPAEE34 pKa = 4.09EE35 pKa = 4.68SPLSPSTTDD44 pKa = 3.28YY45 pKa = 11.26LFPNGADD52 pKa = 3.24QDD54 pKa = 4.22ADD56 pKa = 3.9DD57 pKa = 5.21LAPSPALNLLDD68 pKa = 4.21DD69 pKa = 4.24TFISIDD75 pKa = 3.7DD76 pKa = 4.59GVTPDD81 pKa = 4.6CPHH84 pKa = 6.89DD85 pKa = 3.58PAYY88 pKa = 10.51RR89 pKa = 11.84IHH91 pKa = 6.79LLSRR95 pKa = 11.84TPLVIYY101 pKa = 10.37IEE103 pKa = 4.82GFLTPTEE110 pKa = 4.16ADD112 pKa = 3.29HH113 pKa = 6.88LVNII117 pKa = 5.11
MM1 pKa = 7.91PIKK4 pKa = 10.63LSTILSSLFYY14 pKa = 10.87LLPLYY19 pKa = 10.78LFVLAPLLRR28 pKa = 11.84QFFPAEE34 pKa = 4.09EE35 pKa = 4.68SPLSPSTTDD44 pKa = 3.28YY45 pKa = 11.26LFPNGADD52 pKa = 3.24QDD54 pKa = 4.22ADD56 pKa = 3.9DD57 pKa = 5.21LAPSPALNLLDD68 pKa = 4.21DD69 pKa = 4.24TFISIDD75 pKa = 3.7DD76 pKa = 4.59GVTPDD81 pKa = 4.6CPHH84 pKa = 6.89DD85 pKa = 3.58PAYY88 pKa = 10.51RR89 pKa = 11.84IHH91 pKa = 6.79LLSRR95 pKa = 11.84TPLVIYY101 pKa = 10.37IEE103 pKa = 4.82GFLTPTEE110 pKa = 4.16ADD112 pKa = 3.29HH113 pKa = 6.88LVNII117 pKa = 5.11
Molecular weight: 12.97 kDa
Isoelectric point according different methods:
Protein with the highest isoelectric point:
>tr|A0A421CUH2|A0A421CUH2_9EURO RWD domain-containing protein OS=Aspergillus turcosus OX=1245748 GN=CFD26_101122 PE=3 SV=1
MM1 pKa = 7.18ISLWRR6 pKa = 11.84RR7 pKa = 11.84ILPQRR12 pKa = 11.84IANTGAQLRR21 pKa = 11.84DD22 pKa = 3.42HH23 pKa = 6.41QANEE27 pKa = 3.99RR28 pKa = 11.84TFLSWTRR35 pKa = 11.84MGLGFAAMALALGRR49 pKa = 11.84LDD51 pKa = 5.83AIDD54 pKa = 4.37GMISLALSTPKK65 pKa = 10.52ADD67 pKa = 4.38LLAIPEE73 pKa = 4.21NPGARR78 pKa = 11.84TAAAAAAARR87 pKa = 11.84SGNNSNNSTEE97 pKa = 3.96QPPNQISAYY106 pKa = 9.24LASGLSAATLCQAISVWSFGYY127 pKa = 10.89GIFRR131 pKa = 11.84YY132 pKa = 10.16LSVRR136 pKa = 11.84RR137 pKa = 11.84NLLKK141 pKa = 10.92GQFTPAIWGPAFVTCGCLGVFSSLGLWMEE170 pKa = 3.68QRR172 pKa = 11.84RR173 pKa = 11.84DD174 pKa = 3.21KK175 pKa = 11.36KK176 pKa = 10.7MPP178 pKa = 3.9
MM1 pKa = 7.18ISLWRR6 pKa = 11.84RR7 pKa = 11.84ILPQRR12 pKa = 11.84IANTGAQLRR21 pKa = 11.84DD22 pKa = 3.42HH23 pKa = 6.41QANEE27 pKa = 3.99RR28 pKa = 11.84TFLSWTRR35 pKa = 11.84MGLGFAAMALALGRR49 pKa = 11.84LDD51 pKa = 5.83AIDD54 pKa = 4.37GMISLALSTPKK65 pKa = 10.52ADD67 pKa = 4.38LLAIPEE73 pKa = 4.21NPGARR78 pKa = 11.84TAAAAAAARR87 pKa = 11.84SGNNSNNSTEE97 pKa = 3.96QPPNQISAYY106 pKa = 9.24LASGLSAATLCQAISVWSFGYY127 pKa = 10.89GIFRR131 pKa = 11.84YY132 pKa = 10.16LSVRR136 pKa = 11.84RR137 pKa = 11.84NLLKK141 pKa = 10.92GQFTPAIWGPAFVTCGCLGVFSSLGLWMEE170 pKa = 3.68QRR172 pKa = 11.84RR173 pKa = 11.84DD174 pKa = 3.21KK175 pKa = 11.36KK176 pKa = 10.7MPP178 pKa = 3.9
Molecular weight: 19.24 kDa
Isoelectric point according different methods:
Peptides (in silico digests for buttom-up proteomics)
Below you can find in silico digests of the whole proteome with Trypsin, Chymotrypsin, Trypsin+LysC, LysN, ArgC proteases suitable for different mass spec machines.| Try ESI |
 |
|---|
| ChTry ESI |
 |
|---|
| ArgC ESI |
 |
|---|
| LysN ESI |
 |
|---|
| TryLysC ESI |
 |
|---|
| Try MALDI |
 |
|---|
| ChTry MALDI |
 |
|---|
| ArgC MALDI |
 |
|---|
| LysN MALDI |
 |
|---|
| TryLysC MALDI |
 |
|---|
| Try LTQ |
 |
|---|
| ChTry LTQ |
 |
|---|
| ArgC LTQ |
 |
|---|
| LysN LTQ |
 |
|---|
| TryLysC LTQ |
 |
|---|
| Try MSlow |
 |
|---|
| ChTry MSlow |
 |
|---|
| ArgC MSlow |
 |
|---|
| LysN MSlow |
 |
|---|
| TryLysC MSlow |
 |
|---|
| Try MShigh |
 |
|---|
| ChTry MShigh |
 |
|---|
| ArgC MShigh |
 |
|---|
| LysN MShigh |
 |
|---|
| TryLysC MShigh |
 |
|---|
General Statistics
Number of major isoforms |
Number of additional isoforms |
Number of all proteins |
Number of amino acids |
Min. Seq. Length |
Max. Seq. Length |
Avg. Seq. Length |
Avg. Mol. Weight |
|---|---|---|---|---|---|---|---|
0 |
4845878 |
50 |
7333 |
528.2 |
58.54 |
Amino acid frequency
Ala |
Cys |
Asp |
Glu |
Phe |
Gly |
His |
Ile |
Lys |
Leu |
|---|---|---|---|---|---|---|---|---|---|
8.648 ± 0.02 | 1.229 ± 0.01 |
5.661 ± 0.015 | 6.259 ± 0.027 |
3.734 ± 0.015 | 6.701 ± 0.024 |
2.384 ± 0.01 | 4.911 ± 0.017 |
4.603 ± 0.021 | 9.141 ± 0.025 |
Met |
Asn |
Gln |
Pro |
Arg |
Ser |
Thr |
Val |
Trp |
Tyr |
|---|---|---|---|---|---|---|---|---|---|
2.126 ± 0.009 | 3.603 ± 0.012 |
6.004 ± 0.025 | 4.064 ± 0.015 |
6.247 ± 0.022 | 8.263 ± 0.03 |
5.874 ± 0.017 | 6.24 ± 0.02 |
1.467 ± 0.009 | 2.841 ± 0.012 |
Most of the basic statistics you can see at this page can be downloaded from this CSV file
Proteome-pI is available under Creative Commons Attribution-NoDerivs license, for more details see here
| Reference: Kozlowski LP. Proteome-pI 2.0: Proteome Isoelectric Point Database Update. Nucleic Acids Res. 2021, doi: 10.1093/nar/gkab944 | Contact: Lukasz P. Kozlowski |
