Shrew hepatitis B virus
Taxonomy: Viruses; Riboviria; Pararnavirae; Artverviricota; Revtraviricetes; Blubervirales; Hepadnaviridae; Orthohepadnavirus; unclassified Orthohepadnavirus
Average proteome isoelectric point is 8.62
Get precalculated fractions of proteins

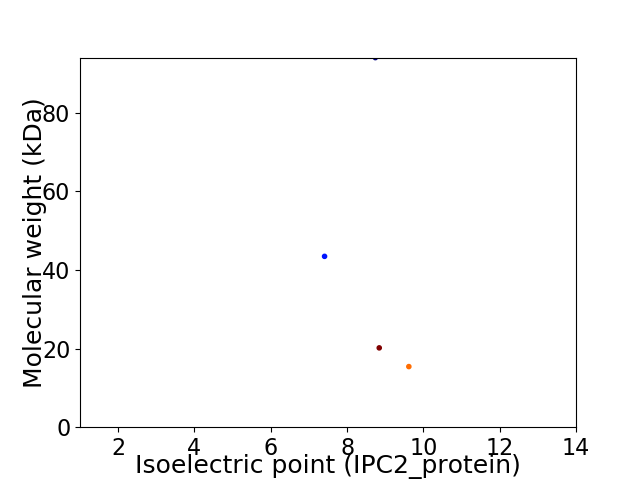
Virtual 2D-PAGE plot for 4 proteins (isoelectric point calculated using IPC2_protein)
Get csv file with sequences according to given criteria:
* You can choose from 21 different methods for calculating isoelectric point
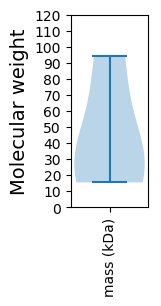
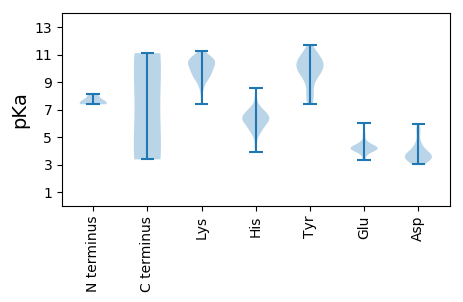
Summary statistics related to proteome-wise predictions


Protein with the lowest isoelectric point:
>tr|A0A481MR26|A0A481MR26_9HEPA Large envelope protein OS=Shrew hepatitis B virus OX=2507572 PE=4 SV=1
MM1 pKa = 7.38GNAVDD6 pKa = 5.29LLGSSLAAGQSYY18 pKa = 9.29GASQGEE24 pKa = 4.4DD25 pKa = 3.67FNPLMDD31 pKa = 5.49LGRR34 pKa = 11.84LLSKK38 pKa = 10.32VNPYY42 pKa = 10.6SRR44 pKa = 11.84LDD46 pKa = 3.54TYY48 pKa = 11.66GDD50 pKa = 3.36WDD52 pKa = 4.08LKK54 pKa = 10.53RR55 pKa = 11.84GNYY58 pKa = 8.75YY59 pKa = 10.29QDD61 pKa = 3.04TSILQGQGQKK71 pKa = 9.83PRR73 pKa = 11.84PPVTPVQPPSPPTRR87 pKa = 11.84GPNRR91 pKa = 11.84VPPLKK96 pKa = 10.23PPQPGTKK103 pKa = 9.41RR104 pKa = 11.84LPINSSQVFPTSSMLRR120 pKa = 11.84PDD122 pKa = 3.22HH123 pKa = 7.06HH124 pKa = 6.52ITPLSKK130 pKa = 10.31EE131 pKa = 4.14IKK133 pKa = 10.0NPPPVPSSASKK144 pKa = 10.91LLVPVEE150 pKa = 4.5NSASSPSLEE159 pKa = 4.1KK160 pKa = 10.54TEE162 pKa = 3.89IGAPVLEE169 pKa = 4.74AMTAEE174 pKa = 4.22PASRR178 pKa = 11.84FLGPLGGLPVVLFLWTRR195 pKa = 11.84IQEE198 pKa = 4.08ILQNLDD204 pKa = 3.05WWWTSLSFPGVSRR217 pKa = 11.84EE218 pKa = 4.08CPGLDD223 pKa = 3.33SQSQTSRR230 pKa = 11.84HH231 pKa = 5.84SLTSCPPTCSGYY243 pKa = 9.73PWMCRR248 pKa = 11.84RR249 pKa = 11.84RR250 pKa = 11.84FIILLCLLLLCLTCWLGYY268 pKa = 10.31LDD270 pKa = 4.8YY271 pKa = 11.3SGEE274 pKa = 4.2LPVCPLGMSGEE285 pKa = 4.4VTTVQCKK292 pKa = 10.15SCTASATGTLGKK304 pKa = 9.19PLCCCLKK311 pKa = 10.76SSGGGNCTCVPIPPSWAFAKK331 pKa = 9.63FLWEE335 pKa = 3.98LVSHH339 pKa = 6.43HH340 pKa = 6.31FSWLSSLLRR349 pKa = 11.84LFQWLEE355 pKa = 4.41GISPTVLLLAIWMIWYY371 pKa = 7.52WVPSLSTIFNLFIPLCLTLWYY392 pKa = 9.75IWGG395 pKa = 3.79
MM1 pKa = 7.38GNAVDD6 pKa = 5.29LLGSSLAAGQSYY18 pKa = 9.29GASQGEE24 pKa = 4.4DD25 pKa = 3.67FNPLMDD31 pKa = 5.49LGRR34 pKa = 11.84LLSKK38 pKa = 10.32VNPYY42 pKa = 10.6SRR44 pKa = 11.84LDD46 pKa = 3.54TYY48 pKa = 11.66GDD50 pKa = 3.36WDD52 pKa = 4.08LKK54 pKa = 10.53RR55 pKa = 11.84GNYY58 pKa = 8.75YY59 pKa = 10.29QDD61 pKa = 3.04TSILQGQGQKK71 pKa = 9.83PRR73 pKa = 11.84PPVTPVQPPSPPTRR87 pKa = 11.84GPNRR91 pKa = 11.84VPPLKK96 pKa = 10.23PPQPGTKK103 pKa = 9.41RR104 pKa = 11.84LPINSSQVFPTSSMLRR120 pKa = 11.84PDD122 pKa = 3.22HH123 pKa = 7.06HH124 pKa = 6.52ITPLSKK130 pKa = 10.31EE131 pKa = 4.14IKK133 pKa = 10.0NPPPVPSSASKK144 pKa = 10.91LLVPVEE150 pKa = 4.5NSASSPSLEE159 pKa = 4.1KK160 pKa = 10.54TEE162 pKa = 3.89IGAPVLEE169 pKa = 4.74AMTAEE174 pKa = 4.22PASRR178 pKa = 11.84FLGPLGGLPVVLFLWTRR195 pKa = 11.84IQEE198 pKa = 4.08ILQNLDD204 pKa = 3.05WWWTSLSFPGVSRR217 pKa = 11.84EE218 pKa = 4.08CPGLDD223 pKa = 3.33SQSQTSRR230 pKa = 11.84HH231 pKa = 5.84SLTSCPPTCSGYY243 pKa = 9.73PWMCRR248 pKa = 11.84RR249 pKa = 11.84RR250 pKa = 11.84FIILLCLLLLCLTCWLGYY268 pKa = 10.31LDD270 pKa = 4.8YY271 pKa = 11.3SGEE274 pKa = 4.2LPVCPLGMSGEE285 pKa = 4.4VTTVQCKK292 pKa = 10.15SCTASATGTLGKK304 pKa = 9.19PLCCCLKK311 pKa = 10.76SSGGGNCTCVPIPPSWAFAKK331 pKa = 9.63FLWEE335 pKa = 3.98LVSHH339 pKa = 6.43HH340 pKa = 6.31FSWLSSLLRR349 pKa = 11.84LFQWLEE355 pKa = 4.41GISPTVLLLAIWMIWYY371 pKa = 7.52WVPSLSTIFNLFIPLCLTLWYY392 pKa = 9.75IWGG395 pKa = 3.79
Molecular weight: 43.49 kDa
Isoelectric point according different methods:
Protein with the highest isoelectric point:
>tr|A0A481MR21|A0A481MR21_9HEPA Core protein OS=Shrew hepatitis B virus OX=2507572 PE=4 SV=1
MM1 pKa = 7.49AARR4 pKa = 11.84MLFDD8 pKa = 5.96LDD10 pKa = 3.89PATGAVRR17 pKa = 11.84LRR19 pKa = 11.84PFLTEE24 pKa = 3.31PRR26 pKa = 11.84GRR28 pKa = 11.84GEE30 pKa = 3.66QTPRR34 pKa = 11.84PTSSPTTSALSSFLGSRR51 pKa = 11.84SSWRR55 pKa = 11.84RR56 pKa = 11.84LPSCADD62 pKa = 3.5SPFGPCTLRR71 pKa = 11.84FTFAEE76 pKa = 4.38LGNLQTPMNSVTFISCRR93 pKa = 11.84SRR95 pKa = 11.84GAHH98 pKa = 5.6LKK100 pKa = 10.31CRR102 pKa = 11.84RR103 pKa = 11.84QQKK106 pKa = 8.65NWTWYY111 pKa = 9.59FWTHH115 pKa = 5.35HH116 pKa = 5.7NANNTHH122 pKa = 6.34HH123 pKa = 7.18LWLMCYY129 pKa = 10.08GGCRR133 pKa = 11.84HH134 pKa = 6.37KK135 pKa = 11.1
MM1 pKa = 7.49AARR4 pKa = 11.84MLFDD8 pKa = 5.96LDD10 pKa = 3.89PATGAVRR17 pKa = 11.84LRR19 pKa = 11.84PFLTEE24 pKa = 3.31PRR26 pKa = 11.84GRR28 pKa = 11.84GEE30 pKa = 3.66QTPRR34 pKa = 11.84PTSSPTTSALSSFLGSRR51 pKa = 11.84SSWRR55 pKa = 11.84RR56 pKa = 11.84LPSCADD62 pKa = 3.5SPFGPCTLRR71 pKa = 11.84FTFAEE76 pKa = 4.38LGNLQTPMNSVTFISCRR93 pKa = 11.84SRR95 pKa = 11.84GAHH98 pKa = 5.6LKK100 pKa = 10.31CRR102 pKa = 11.84RR103 pKa = 11.84QQKK106 pKa = 8.65NWTWYY111 pKa = 9.59FWTHH115 pKa = 5.35HH116 pKa = 5.7NANNTHH122 pKa = 6.34HH123 pKa = 7.18LWLMCYY129 pKa = 10.08GGCRR133 pKa = 11.84HH134 pKa = 6.37KK135 pKa = 11.1
Molecular weight: 15.43 kDa
Isoelectric point according different methods:
Peptides (in silico digests for buttom-up proteomics)
Below you can find in silico digests of the whole proteome with Trypsin, Chymotrypsin, Trypsin+LysC, LysN, ArgC proteases suitable for different mass spec machines.| Try ESI |
 |
|---|
| ChTry ESI |
 |
|---|
| ArgC ESI |
 |
|---|
| LysN ESI |
 |
|---|
| TryLysC ESI |
 |
|---|
| Try MALDI |
 |
|---|
| ChTry MALDI |
 |
|---|
| ArgC MALDI |
 |
|---|
| LysN MALDI |
 |
|---|
| TryLysC MALDI |
 |
|---|
| Try LTQ |
 |
|---|
| ChTry LTQ |
 |
|---|
| ArgC LTQ |
 |
|---|
| LysN LTQ |
 |
|---|
| TryLysC LTQ |
 |
|---|
| Try MSlow |
 |
|---|
| ChTry MSlow |
 |
|---|
| ArgC MSlow |
 |
|---|
| LysN MSlow |
 |
|---|
| TryLysC MSlow |
 |
|---|
| Try MShigh |
 |
|---|
| ChTry MShigh |
 |
|---|
| ArgC MShigh |
 |
|---|
| LysN MShigh |
 |
|---|
| TryLysC MShigh |
 |
|---|
General Statistics
Number of major isoforms |
Number of additional isoforms |
Number of all proteins |
Number of amino acids |
Min. Seq. Length |
Max. Seq. Length |
Avg. Seq. Length |
Avg. Mol. Weight |
|---|---|---|---|---|---|---|---|
0 |
1544 |
135 |
834 |
386.0 |
43.3 |
Amino acid frequency
Ala |
Cys |
Asp |
Glu |
Phe |
Gly |
His |
Ile |
Lys |
Leu |
|---|---|---|---|---|---|---|---|---|---|
5.505 ± 0.832 | 2.85 ± 0.624 |
3.109 ± 0.384 | 3.238 ± 0.207 |
4.728 ± 0.685 | 6.93 ± 0.264 |
4.08 ± 1.116 | 3.303 ± 0.54 |
3.886 ± 0.545 | 12.565 ± 0.826 |
Met |
Asn |
Gln |
Pro |
Arg |
Ser |
Thr |
Val |
Trp |
Tyr |
|---|---|---|---|---|---|---|---|---|---|
1.684 ± 0.274 | 3.109 ± 0.277 |
8.161 ± 1.166 | 4.663 ± 0.557 |
5.764 ± 1.292 | 9.909 ± 0.882 |
5.894 ± 1.017 | 4.922 ± 0.715 |
2.785 ± 0.56 | 2.915 ± 0.459 |
Most of the basic statistics you can see at this page can be downloaded from this CSV file
Proteome-pI is available under Creative Commons Attribution-NoDerivs license, for more details see here
| Reference: Kozlowski LP. Proteome-pI 2.0: Proteome Isoelectric Point Database Update. Nucleic Acids Res. 2021, doi: 10.1093/nar/gkab944 | Contact: Lukasz P. Kozlowski |
