Pseudomonas virus PBPA162
Taxonomy: Viruses; Duplodnaviria; Heunggongvirae; Uroviricota; Caudoviricetes; Caudovirales; Siphoviridae; unclassified Siphoviridae
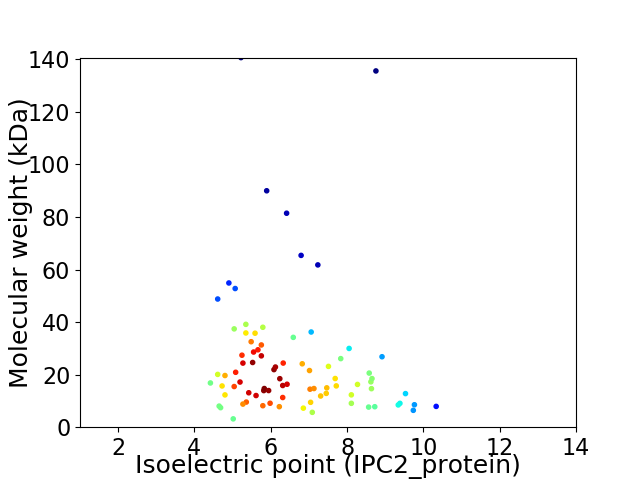
Average proteome isoelectric point is 6.54
Get precalculated fractions of proteins

Virtual 2D-PAGE plot for 83 proteins (isoelectric point calculated using IPC2_protein)
Get csv file with sequences according to given criteria:
* You can choose from 21 different methods for calculating isoelectric point
Summary statistics related to proteome-wise predictions


Protein with the lowest isoelectric point:
>tr|A0A4Y5TNB4|A0A4Y5TNB4_9CAUD GTP cyclohydrolase I OS=Pseudomonas virus PBPA162 OX=2588096 GN=folE PE=3 SV=1
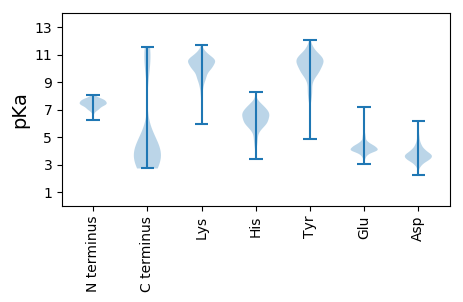
MM1 pKa = 7.33TEE3 pKa = 3.81YY4 pKa = 10.9AGLYY8 pKa = 8.69TPVNFVDD15 pKa = 4.38PPTPSGLPEE24 pKa = 4.96DD25 pKa = 4.34LTPVGYY31 pKa = 8.48ITHH34 pKa = 7.17DD35 pKa = 3.21EE36 pKa = 4.18RR37 pKa = 11.84GFITGSMFCQPRR49 pKa = 11.84CVEE52 pKa = 4.23SNAMGRR58 pKa = 11.84LYY60 pKa = 10.6LRR62 pKa = 11.84HH63 pKa = 6.83DD64 pKa = 3.96NYY66 pKa = 11.19SASKK70 pKa = 10.13ALWYY74 pKa = 9.83VQGGALVARR83 pKa = 11.84PMLPYY88 pKa = 9.96TLRR91 pKa = 11.84EE92 pKa = 3.92NVLVGVPQGATLRR105 pKa = 11.84IEE107 pKa = 4.31GVEE110 pKa = 4.04YY111 pKa = 9.28TADD114 pKa = 3.5GTDD117 pKa = 3.13IEE119 pKa = 5.4LSFSHH124 pKa = 6.62SGTFIVEE131 pKa = 4.01VDD133 pKa = 3.9PFPYY137 pKa = 9.75QAFEE141 pKa = 4.33VEE143 pKa = 4.55VEE145 pKa = 4.34YY146 pKa = 10.39EE147 pKa = 4.4APTQSS152 pKa = 3.07
MM1 pKa = 7.33TEE3 pKa = 3.81YY4 pKa = 10.9AGLYY8 pKa = 8.69TPVNFVDD15 pKa = 4.38PPTPSGLPEE24 pKa = 4.96DD25 pKa = 4.34LTPVGYY31 pKa = 8.48ITHH34 pKa = 7.17DD35 pKa = 3.21EE36 pKa = 4.18RR37 pKa = 11.84GFITGSMFCQPRR49 pKa = 11.84CVEE52 pKa = 4.23SNAMGRR58 pKa = 11.84LYY60 pKa = 10.6LRR62 pKa = 11.84HH63 pKa = 6.83DD64 pKa = 3.96NYY66 pKa = 11.19SASKK70 pKa = 10.13ALWYY74 pKa = 9.83VQGGALVARR83 pKa = 11.84PMLPYY88 pKa = 9.96TLRR91 pKa = 11.84EE92 pKa = 3.92NVLVGVPQGATLRR105 pKa = 11.84IEE107 pKa = 4.31GVEE110 pKa = 4.04YY111 pKa = 9.28TADD114 pKa = 3.5GTDD117 pKa = 3.13IEE119 pKa = 5.4LSFSHH124 pKa = 6.62SGTFIVEE131 pKa = 4.01VDD133 pKa = 3.9PFPYY137 pKa = 9.75QAFEE141 pKa = 4.33VEE143 pKa = 4.55VEE145 pKa = 4.34YY146 pKa = 10.39EE147 pKa = 4.4APTQSS152 pKa = 3.07
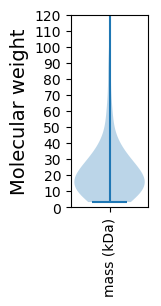
Molecular weight: 16.83 kDa
Isoelectric point according different methods:
Protein with the highest isoelectric point:
>tr|A0A4Y5TNE0|A0A4Y5TNE0_9CAUD Uncharacterized protein OS=Pseudomonas virus PBPA162 OX=2588096 PE=4 SV=1
MM1 pKa = 6.92QHH3 pKa = 5.85TEE5 pKa = 4.1RR6 pKa = 11.84EE7 pKa = 4.3SLRR10 pKa = 11.84AVAAMVDD17 pKa = 3.6QAIEE21 pKa = 3.89KK22 pKa = 9.79CIADD26 pKa = 3.77MRR28 pKa = 11.84PFSLLPVSKK37 pKa = 10.41LDD39 pKa = 3.19AVTYY43 pKa = 10.16MFDD46 pKa = 3.46APGAAWRR53 pKa = 11.84TVVTRR58 pKa = 11.84EE59 pKa = 3.57QRR61 pKa = 11.84VAARR65 pKa = 11.84GVTRR69 pKa = 11.84EE70 pKa = 4.04LATKK74 pKa = 10.07RR75 pKa = 11.84LMVGLVGAAAQAVLISNAYY94 pKa = 8.12TPRR97 pKa = 11.84QAQYY101 pKa = 10.97AASQAAWARR110 pKa = 11.84RR111 pKa = 11.84WLVTLL116 pKa = 4.56
MM1 pKa = 6.92QHH3 pKa = 5.85TEE5 pKa = 4.1RR6 pKa = 11.84EE7 pKa = 4.3SLRR10 pKa = 11.84AVAAMVDD17 pKa = 3.6QAIEE21 pKa = 3.89KK22 pKa = 9.79CIADD26 pKa = 3.77MRR28 pKa = 11.84PFSLLPVSKK37 pKa = 10.41LDD39 pKa = 3.19AVTYY43 pKa = 10.16MFDD46 pKa = 3.46APGAAWRR53 pKa = 11.84TVVTRR58 pKa = 11.84EE59 pKa = 3.57QRR61 pKa = 11.84VAARR65 pKa = 11.84GVTRR69 pKa = 11.84EE70 pKa = 4.04LATKK74 pKa = 10.07RR75 pKa = 11.84LMVGLVGAAAQAVLISNAYY94 pKa = 8.12TPRR97 pKa = 11.84QAQYY101 pKa = 10.97AASQAAWARR110 pKa = 11.84RR111 pKa = 11.84WLVTLL116 pKa = 4.56
Molecular weight: 12.79 kDa
Isoelectric point according different methods:
Peptides (in silico digests for buttom-up proteomics)
Below you can find in silico digests of the whole proteome with Trypsin, Chymotrypsin, Trypsin+LysC, LysN, ArgC proteases suitable for different mass spec machines.| Try ESI |
 |
|---|
| ChTry ESI |
 |
|---|
| ArgC ESI |
 |
|---|
| LysN ESI |
 |
|---|
| TryLysC ESI |
 |
|---|
| Try MALDI |
 |
|---|
| ChTry MALDI |
 |
|---|
| ArgC MALDI |
 |
|---|
| LysN MALDI |
 |
|---|
| TryLysC MALDI |
 |
|---|
| Try LTQ |
 |
|---|
| ChTry LTQ |
 |
|---|
| ArgC LTQ |
 |
|---|
| LysN LTQ |
 |
|---|
| TryLysC LTQ |
 |
|---|
| Try MSlow |
 |
|---|
| ChTry MSlow |
 |
|---|
| ArgC MSlow |
 |
|---|
| LysN MSlow |
 |
|---|
| TryLysC MSlow |
 |
|---|
| Try MShigh |
 |
|---|
| ChTry MShigh |
 |
|---|
| ArgC MShigh |
 |
|---|
| LysN MShigh |
 |
|---|
| TryLysC MShigh |
 |
|---|
General Statistics
Number of major isoforms |
Number of additional isoforms |
Number of all proteins |
Number of amino acids |
Min. Seq. Length |
Max. Seq. Length |
Avg. Seq. Length |
Avg. Mol. Weight |
|---|---|---|---|---|---|---|---|
0 |
18612 |
32 |
1291 |
224.2 |
24.91 |
Amino acid frequency
Ala |
Cys |
Asp |
Glu |
Phe |
Gly |
His |
Ile |
Lys |
Leu |
|---|---|---|---|---|---|---|---|---|---|
9.913 ± 0.79 | 1.499 ± 0.188 |
5.319 ± 0.163 | 6.216 ± 0.294 |
3.052 ± 0.162 | 7.484 ± 0.252 |
2.343 ± 0.241 | 4.513 ± 0.193 |
5.056 ± 0.255 | 8.532 ± 0.234 |
Met |
Asn |
Gln |
Pro |
Arg |
Ser |
Thr |
Val |
Trp |
Tyr |
|---|---|---|---|---|---|---|---|---|---|
3.106 ± 0.18 | 4.245 ± 0.233 |
4.712 ± 0.34 | 4.857 ± 0.3 |
5.856 ± 0.218 | 5.179 ± 0.16 |
5.539 ± 0.293 | 7.554 ± 0.212 |
1.623 ± 0.129 | 3.401 ± 0.236 |
Most of the basic statistics you can see at this page can be downloaded from this CSV file
Proteome-pI is available under Creative Commons Attribution-NoDerivs license, for more details see here
| Reference: Kozlowski LP. Proteome-pI 2.0: Proteome Isoelectric Point Database Update. Nucleic Acids Res. 2021, doi: 10.1093/nar/gkab944 | Contact: Lukasz P. Kozlowski |
