Podoviridae sp. ctDWo9
Taxonomy: Viruses; Duplodnaviria; Heunggongvirae; Uroviricota; Caudoviricetes; Caudovirales; Podoviridae; unclassified Podoviridae
Average proteome isoelectric point is 6.81
Get precalculated fractions of proteins
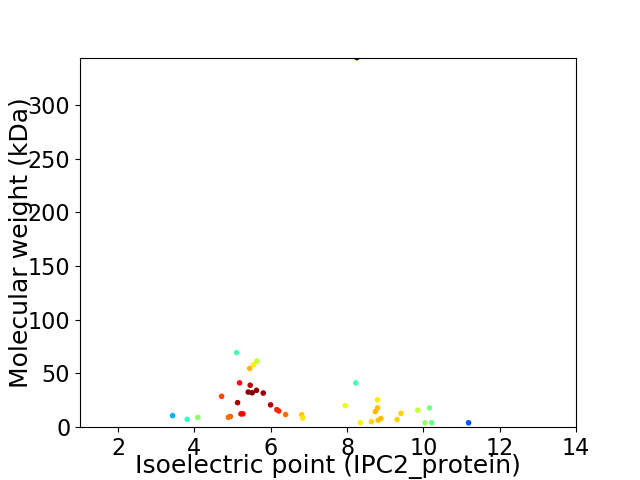
Virtual 2D-PAGE plot for 42 proteins (isoelectric point calculated using IPC2_protein)
Get csv file with sequences according to given criteria:
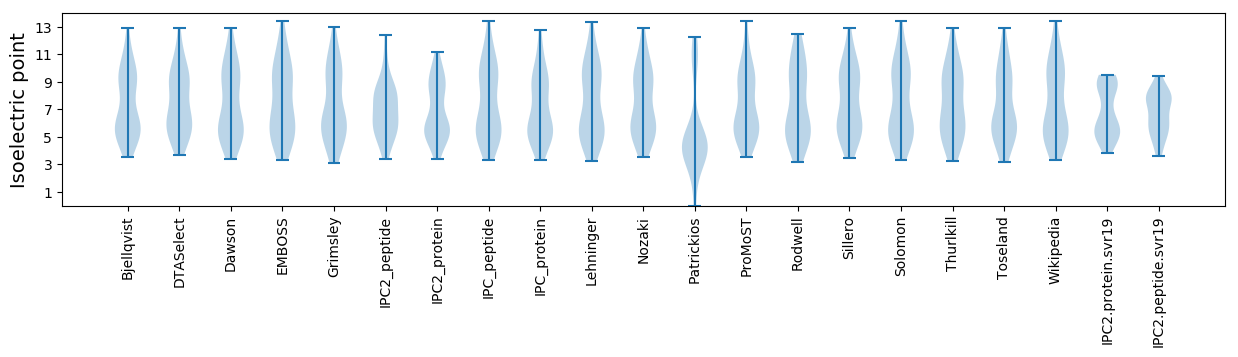
* You can choose from 21 different methods for calculating isoelectric point
Summary statistics related to proteome-wise predictions
Protein with the lowest isoelectric point:
>tr|A0A5Q2WAS3|A0A5Q2WAS3_9CAUD Tail fiber protein OS=Podoviridae sp. ctDWo9 OX=2656708 PE=4 SV=1
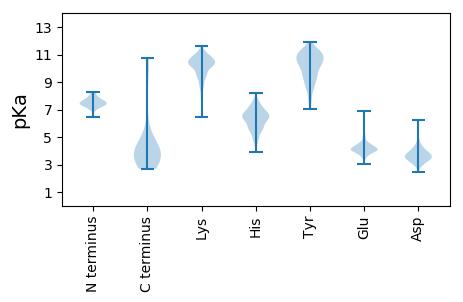
MM1 pKa = 7.46AHH3 pKa = 6.83FAHH6 pKa = 7.19ISNGQVSQVIVISNDD21 pKa = 3.12DD22 pKa = 3.64CGGGDD27 pKa = 4.03FPQSEE32 pKa = 4.56PVGQAFIASLWLSGEE47 pKa = 3.97WRR49 pKa = 11.84QTSYY53 pKa = 11.26NANFRR58 pKa = 11.84GKK60 pKa = 10.07YY61 pKa = 10.04AGIGDD66 pKa = 4.46TYY68 pKa = 11.37DD69 pKa = 3.45ADD71 pKa = 4.03ADD73 pKa = 4.15EE74 pKa = 4.97FTSPPIAEE82 pKa = 4.12PTAA85 pKa = 3.76
MM1 pKa = 7.46AHH3 pKa = 6.83FAHH6 pKa = 7.19ISNGQVSQVIVISNDD21 pKa = 3.12DD22 pKa = 3.64CGGGDD27 pKa = 4.03FPQSEE32 pKa = 4.56PVGQAFIASLWLSGEE47 pKa = 3.97WRR49 pKa = 11.84QTSYY53 pKa = 11.26NANFRR58 pKa = 11.84GKK60 pKa = 10.07YY61 pKa = 10.04AGIGDD66 pKa = 4.46TYY68 pKa = 11.37DD69 pKa = 3.45ADD71 pKa = 4.03ADD73 pKa = 4.15EE74 pKa = 4.97FTSPPIAEE82 pKa = 4.12PTAA85 pKa = 3.76
Molecular weight: 9.1 kDa
Isoelectric point according different methods:
Protein with the highest isoelectric point:
>tr|A0A5Q2W8J7|A0A5Q2W8J7_9CAUD Uncharacterized protein OS=Podoviridae sp. ctDWo9 OX=2656708 PE=4 SV=1
MM1 pKa = 7.27GGVRR5 pKa = 11.84GGQRR9 pKa = 11.84NLPLRR14 pKa = 11.84RR15 pKa = 11.84PSRR18 pKa = 11.84RR19 pKa = 11.84GKK21 pKa = 8.57PARR24 pKa = 11.84RR25 pKa = 11.84TRR27 pKa = 11.84NALRR31 pKa = 11.84NHH33 pKa = 6.54LWW35 pKa = 3.19
MM1 pKa = 7.27GGVRR5 pKa = 11.84GGQRR9 pKa = 11.84NLPLRR14 pKa = 11.84RR15 pKa = 11.84PSRR18 pKa = 11.84RR19 pKa = 11.84GKK21 pKa = 8.57PARR24 pKa = 11.84RR25 pKa = 11.84TRR27 pKa = 11.84NALRR31 pKa = 11.84NHH33 pKa = 6.54LWW35 pKa = 3.19
Molecular weight: 4.09 kDa
Isoelectric point according different methods:
Peptides (in silico digests for buttom-up proteomics)
Below you can find in silico digests of the whole proteome with Trypsin, Chymotrypsin, Trypsin+LysC, LysN, ArgC proteases suitable for different mass spec machines.| Try ESI |
 |
|---|
| ChTry ESI |
|
|---|
| ArgC ESI |
|
|---|
| LysN ESI |
|
|---|
| TryLysC ESI |
|
|---|
| Try MALDI |
|
|---|
| ChTry MALDI |
|
|---|
| ArgC MALDI |
|
|---|
| LysN MALDI |
|
|---|
| TryLysC MALDI |
|
|---|
| Try LTQ |
|
|---|
| ChTry LTQ |
|
|---|
| ArgC LTQ |
|
|---|
| LysN LTQ |
|
|---|
| TryLysC LTQ |
|
|---|
| Try MSlow |
|
|---|
| ChTry MSlow |
|
|---|
| ArgC MSlow |
|
|---|
| LysN MSlow |
|
|---|
| TryLysC MSlow |
|
|---|
| Try MShigh |
|
|---|
| ChTry MShigh |
|
|---|
| ArgC MShigh |
|
|---|
| LysN MShigh |
|
|---|
| TryLysC MShigh |
|
|---|
General Statistics
Number of major isoforms |
Number of additional isoforms |
Number of all proteins |
Number of amino acids |
Min. Seq. Length |
Max. Seq. Length |
Avg. Seq. Length |
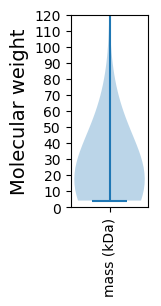
Avg. Mol. Weight |
|---|---|---|---|---|---|---|---|
0 |
11048 |
34 |
3154 |
263.0 |
28.93 |
Amino acid frequency
Ala |
Cys |
Asp |
Glu |
Phe |
Gly |
His |
Ile |
Lys |
Leu |
|---|---|---|---|---|---|---|---|---|---|
10.88 ± 0.971 | 0.824 ± 0.274 |
5.829 ± 0.246 | 6.363 ± 0.491 |
3.231 ± 0.211 | 8.599 ± 0.847 |
1.828 ± 0.218 | 3.919 ± 0.192 |
5.051 ± 0.512 | 8.02 ± 0.324 |
Met |
Asn |
Gln |
Pro |
Arg |
Ser |
Thr |
Val |
Trp |
Tyr |
|---|---|---|---|---|---|---|---|---|---|
2.589 ± 0.2 | 4.091 ± 0.285 |
4.127 ± 0.329 | 3.376 ± 0.301 |
7.024 ± 0.399 | 6.897 ± 0.432 |
5.965 ± 0.393 | 6.445 ± 0.292 |
1.693 ± 0.306 | 3.249 ± 0.37 |
Most of the basic statistics you can see at this page can be downloaded from this CSV file
See this proteome in:

Proteome-pI is available under Creative Commons Attribution-NoDerivs license, for more details see here
| Reference: Kozlowski LP. Proteome-pI 2.0: Proteome Isoelectric Point Database Update. Nucleic Acids Res. 2021, doi: 10.1093/nar/gkab944 | Contact: Lukasz P. Kozlowski |