Porphyromonas endodontalis (strain ATCC 35406 / BCRC 14492 / JCM 8526 / NCTC 13058 / HG 370)
Taxonomy: cellular organisms; Bacteria; FCB group; Bacteroidetes/Chlorobi group; Bacteroidetes; Bacteroidia; Bacteroidales; Porphyromonadaceae; Porphyromonas; Porphyromonas endodontalis
Average proteome isoelectric point is 6.67
Get precalculated fractions of proteins

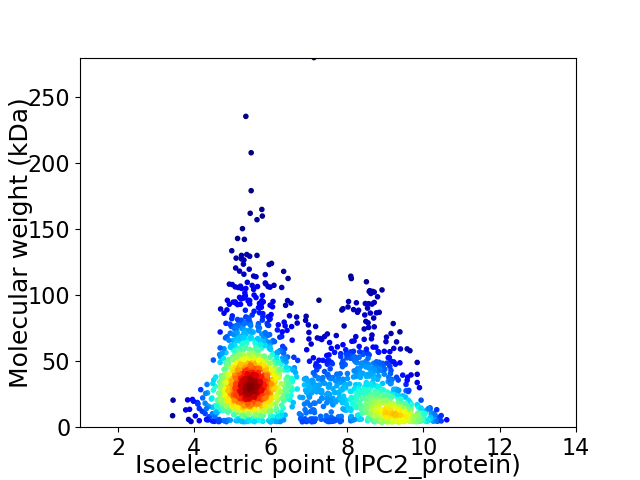
Virtual 2D-PAGE plot for 1965 proteins (isoelectric point calculated using IPC2_protein)
Get csv file with sequences according to given criteria:
* You can choose from 21 different methods for calculating isoelectric point
Summary statistics related to proteome-wise predictions


Protein with the lowest isoelectric point:
>tr|C3J9E9|C3J9E9_POREA PAP2 family protein OS=Porphyromonas endodontalis (strain ATCC 35406 / BCRC 14492 / JCM 8526 / NCTC 13058 / HG 370) OX=553175 GN=POREN0001_1093 PE=4 SV=1
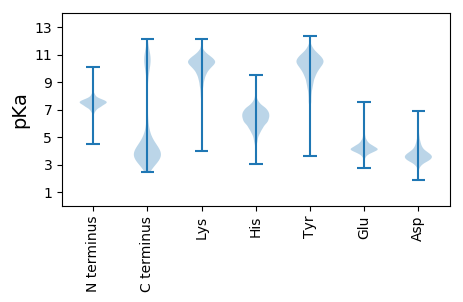
MM1 pKa = 7.63EE2 pKa = 4.62ATDD5 pKa = 4.17LNEE8 pKa = 3.23ARR10 pKa = 11.84IYY12 pKa = 10.4VGTYY16 pKa = 9.66AKK18 pKa = 10.48YY19 pKa = 11.08NNGSLQGEE27 pKa = 4.35WVEE30 pKa = 5.59LSDD33 pKa = 6.54FYY35 pKa = 11.8DD36 pKa = 3.73LDD38 pKa = 3.98GFMEE42 pKa = 4.67RR43 pKa = 11.84CAEE46 pKa = 3.73IHH48 pKa = 6.44EE49 pKa = 4.91DD50 pKa = 3.87EE51 pKa = 4.66EE52 pKa = 5.21APEE55 pKa = 3.96YY56 pKa = 10.31MFQAWEE62 pKa = 4.46EE63 pKa = 4.28IPDD66 pKa = 3.75GLIDD70 pKa = 4.0EE71 pKa = 4.67GHH73 pKa = 6.61LEE75 pKa = 3.97EE76 pKa = 5.04TFFEE80 pKa = 5.11LRR82 pKa = 11.84DD83 pKa = 3.54EE84 pKa = 4.95LDD86 pKa = 3.37RR87 pKa = 11.84LNDD90 pKa = 3.65KK91 pKa = 10.7EE92 pKa = 5.76KK93 pKa = 10.68GAFWVWADD101 pKa = 3.79GNSSQLTQDD110 pKa = 3.22AYY112 pKa = 11.76SLVKK116 pKa = 10.47SFQSDD121 pKa = 4.36YY122 pKa = 10.36IGSYY126 pKa = 10.73ASRR129 pKa = 11.84EE130 pKa = 4.07DD131 pKa = 3.69FAEE134 pKa = 4.24EE135 pKa = 3.68LAKK138 pKa = 10.14MEE140 pKa = 4.32NALSDD145 pKa = 3.48FALNYY150 pKa = 10.23FDD152 pKa = 3.98FSKK155 pKa = 11.2YY156 pKa = 10.79ADD158 pKa = 4.7DD159 pKa = 5.56LFDD162 pKa = 3.53MDD164 pKa = 4.02FWYY167 pKa = 11.21NDD169 pKa = 3.24GYY171 pKa = 10.84VFRR174 pKa = 11.84NNN176 pKa = 3.2
MM1 pKa = 7.63EE2 pKa = 4.62ATDD5 pKa = 4.17LNEE8 pKa = 3.23ARR10 pKa = 11.84IYY12 pKa = 10.4VGTYY16 pKa = 9.66AKK18 pKa = 10.48YY19 pKa = 11.08NNGSLQGEE27 pKa = 4.35WVEE30 pKa = 5.59LSDD33 pKa = 6.54FYY35 pKa = 11.8DD36 pKa = 3.73LDD38 pKa = 3.98GFMEE42 pKa = 4.67RR43 pKa = 11.84CAEE46 pKa = 3.73IHH48 pKa = 6.44EE49 pKa = 4.91DD50 pKa = 3.87EE51 pKa = 4.66EE52 pKa = 5.21APEE55 pKa = 3.96YY56 pKa = 10.31MFQAWEE62 pKa = 4.46EE63 pKa = 4.28IPDD66 pKa = 3.75GLIDD70 pKa = 4.0EE71 pKa = 4.67GHH73 pKa = 6.61LEE75 pKa = 3.97EE76 pKa = 5.04TFFEE80 pKa = 5.11LRR82 pKa = 11.84DD83 pKa = 3.54EE84 pKa = 4.95LDD86 pKa = 3.37RR87 pKa = 11.84LNDD90 pKa = 3.65KK91 pKa = 10.7EE92 pKa = 5.76KK93 pKa = 10.68GAFWVWADD101 pKa = 3.79GNSSQLTQDD110 pKa = 3.22AYY112 pKa = 11.76SLVKK116 pKa = 10.47SFQSDD121 pKa = 4.36YY122 pKa = 10.36IGSYY126 pKa = 10.73ASRR129 pKa = 11.84EE130 pKa = 4.07DD131 pKa = 3.69FAEE134 pKa = 4.24EE135 pKa = 3.68LAKK138 pKa = 10.14MEE140 pKa = 4.32NALSDD145 pKa = 3.48FALNYY150 pKa = 10.23FDD152 pKa = 3.98FSKK155 pKa = 11.2YY156 pKa = 10.79ADD158 pKa = 4.7DD159 pKa = 5.56LFDD162 pKa = 3.53MDD164 pKa = 4.02FWYY167 pKa = 11.21NDD169 pKa = 3.24GYY171 pKa = 10.84VFRR174 pKa = 11.84NNN176 pKa = 3.2
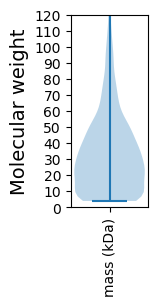
Molecular weight: 20.7 kDa
Isoelectric point according different methods:
Protein with the highest isoelectric point:
>tr|C3JA08|C3JA08_POREA Uncharacterized protein OS=Porphyromonas endodontalis (strain ATCC 35406 / BCRC 14492 / JCM 8526 / NCTC 13058 / HG 370) OX=553175 GN=POREN0001_0930 PE=4 SV=1
MM1 pKa = 7.34GVYY4 pKa = 9.91EE5 pKa = 5.27SPDD8 pKa = 3.44SLLKK12 pKa = 9.82EE13 pKa = 4.0HH14 pKa = 6.47RR15 pKa = 11.84QEE17 pKa = 3.46ISGIRR22 pKa = 11.84KK23 pKa = 8.6LAYY26 pKa = 9.18RR27 pKa = 11.84HH28 pKa = 6.25LGRR31 pKa = 11.84HH32 pKa = 5.73LMNCNVKK39 pKa = 10.27KK40 pKa = 10.03IRR42 pKa = 11.84NRR44 pKa = 11.84RR45 pKa = 11.84RR46 pKa = 11.84AKK48 pKa = 10.55DD49 pKa = 3.03II50 pKa = 3.92
MM1 pKa = 7.34GVYY4 pKa = 9.91EE5 pKa = 5.27SPDD8 pKa = 3.44SLLKK12 pKa = 9.82EE13 pKa = 4.0HH14 pKa = 6.47RR15 pKa = 11.84QEE17 pKa = 3.46ISGIRR22 pKa = 11.84KK23 pKa = 8.6LAYY26 pKa = 9.18RR27 pKa = 11.84HH28 pKa = 6.25LGRR31 pKa = 11.84HH32 pKa = 5.73LMNCNVKK39 pKa = 10.27KK40 pKa = 10.03IRR42 pKa = 11.84NRR44 pKa = 11.84RR45 pKa = 11.84RR46 pKa = 11.84AKK48 pKa = 10.55DD49 pKa = 3.03II50 pKa = 3.92
Molecular weight: 5.99 kDa
Isoelectric point according different methods:
Peptides (in silico digests for buttom-up proteomics)
Below you can find in silico digests of the whole proteome with Trypsin, Chymotrypsin, Trypsin+LysC, LysN, ArgC proteases suitable for different mass spec machines.| Try ESI |
 |
|---|
| ChTry ESI |
 |
|---|
| ArgC ESI |
 |
|---|
| LysN ESI |
 |
|---|
| TryLysC ESI |
 |
|---|
| Try MALDI |
 |
|---|
| ChTry MALDI |
 |
|---|
| ArgC MALDI |
 |
|---|
| LysN MALDI |
 |
|---|
| TryLysC MALDI |
 |
|---|
| Try LTQ |
 |
|---|
| ChTry LTQ |
 |
|---|
| ArgC LTQ |
 |
|---|
| LysN LTQ |
 |
|---|
| TryLysC LTQ |
 |
|---|
| Try MSlow |
 |
|---|
| ChTry MSlow |
 |
|---|
| ArgC MSlow |
 |
|---|
| LysN MSlow |
 |
|---|
| TryLysC MSlow |
 |
|---|
| Try MShigh |
 |
|---|
| ChTry MShigh |
 |
|---|
| ArgC MShigh |
 |
|---|
| LysN MShigh |
 |
|---|
| TryLysC MShigh |
 |
|---|
General Statistics
Number of major isoforms |
Number of additional isoforms |
Number of all proteins |
Number of amino acids |
Min. Seq. Length |
Max. Seq. Length |
Avg. Seq. Length |
Avg. Mol. Weight |
|---|---|---|---|---|---|---|---|
0 |
619246 |
35 |
2494 |
315.1 |
35.33 |
Amino acid frequency
Ala |
Cys |
Asp |
Glu |
Phe |
Gly |
His |
Ile |
Lys |
Leu |
|---|---|---|---|---|---|---|---|---|---|
7.806 ± 0.056 | 1.105 ± 0.021 |
5.042 ± 0.043 | 7.031 ± 0.063 |
4.209 ± 0.03 | 6.891 ± 0.046 |
2.132 ± 0.022 | 6.436 ± 0.049 |
5.717 ± 0.059 | 10.255 ± 0.077 |
Met |
Asn |
Gln |
Pro |
Arg |
Ser |
Thr |
Val |
Trp |
Tyr |
|---|---|---|---|---|---|---|---|---|---|
2.395 ± 0.024 | 3.989 ± 0.041 |
4.308 ± 0.033 | 3.626 ± 0.035 |
5.533 ± 0.045 | 6.692 ± 0.042 |
5.52 ± 0.042 | 6.36 ± 0.045 |
1.068 ± 0.02 | 3.887 ± 0.036 |
Most of the basic statistics you can see at this page can be downloaded from this CSV file
Proteome-pI is available under Creative Commons Attribution-NoDerivs license, for more details see here
| Reference: Kozlowski LP. Proteome-pI 2.0: Proteome Isoelectric Point Database Update. Nucleic Acids Res. 2021, doi: 10.1093/nar/gkab944 | Contact: Lukasz P. Kozlowski |
