Weissella halotolerans DSM 20190
Taxonomy: cellular organisms; Bacteria; Terrabacteria group; Firmicutes; Bacilli; Lactobacillales; Lactobacillaceae; Weissella; Weissella halotolerans
Average proteome isoelectric point is 6.56
Get precalculated fractions of proteins

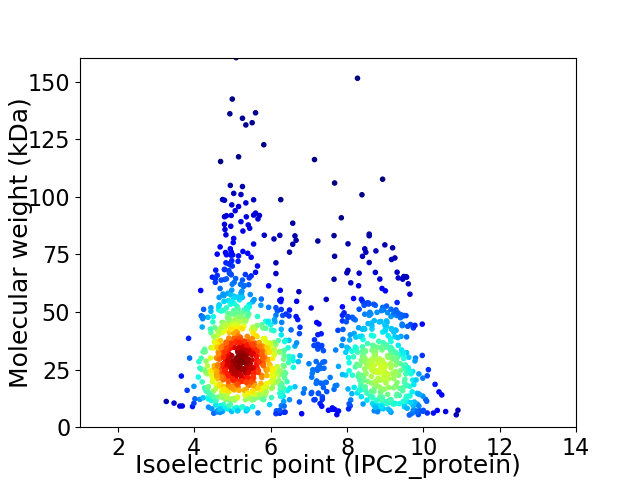
Virtual 2D-PAGE plot for 1304 proteins (isoelectric point calculated using IPC2_protein)
Get csv file with sequences according to given criteria:
* You can choose from 21 different methods for calculating isoelectric point
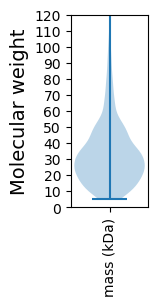
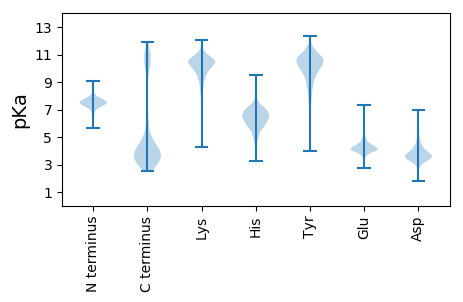
Summary statistics related to proteome-wise predictions


Protein with the lowest isoelectric point:
>tr|A0A0R2FZ71|A0A0R2FZ71_9LACO Nudix hydrolase domain-containing protein OS=Weissella halotolerans DSM 20190 OX=1123500 GN=IV68_GL000291 PE=3 SV=1
MM1 pKa = 7.72NYY3 pKa = 7.62QTFARR8 pKa = 11.84LYY10 pKa = 9.65DD11 pKa = 3.45QLFDD15 pKa = 3.67EE16 pKa = 5.02EE17 pKa = 5.96AYY19 pKa = 10.36EE20 pKa = 4.19DD21 pKa = 3.53WLAYY25 pKa = 8.89AHH27 pKa = 5.95QVIRR31 pKa = 11.84QPEE34 pKa = 4.5GPLLEE39 pKa = 4.42LAGGAGRR46 pKa = 11.84LAIMMKK52 pKa = 8.55QTGFPEE58 pKa = 4.15VMNFDD63 pKa = 4.15LSEE66 pKa = 4.1EE67 pKa = 4.17MLTLAAEE74 pKa = 4.6HH75 pKa = 6.03AQEE78 pKa = 5.41AGVQLPLIQGDD89 pKa = 3.52MRR91 pKa = 11.84EE92 pKa = 4.01WSGLEE97 pKa = 3.83LTFQTITCFADD108 pKa = 3.27SLNYY112 pKa = 10.39LADD115 pKa = 3.93EE116 pKa = 4.19QALLQTFQQVAQHH129 pKa = 6.1LVVGGQFIFDD139 pKa = 4.44VITPKK144 pKa = 9.23QTDD147 pKa = 4.22DD148 pKa = 3.34IYY150 pKa = 10.87PGYY153 pKa = 9.25MYY155 pKa = 10.7NWHH158 pKa = 7.39DD159 pKa = 3.78EE160 pKa = 3.91QTAFMWSSFAVPEE173 pKa = 4.04VAHH176 pKa = 5.94QIEE179 pKa = 4.5HH180 pKa = 6.66EE181 pKa = 4.41LTFFMYY187 pKa = 10.38QEE189 pKa = 4.92EE190 pKa = 4.33IDD192 pKa = 4.87GYY194 pKa = 8.54QQVQEE199 pKa = 3.98FHH201 pKa = 6.32MEE203 pKa = 3.68RR204 pKa = 11.84TYY206 pKa = 11.33PLATYY211 pKa = 9.79QHH213 pKa = 7.54LLTKK217 pKa = 10.6AGFSNIQVSANYY229 pKa = 9.71GKK231 pKa = 10.13QDD233 pKa = 3.95DD234 pKa = 4.29LAGATRR240 pKa = 11.84WFFNVTKK247 pKa = 10.22EE248 pKa = 3.89
MM1 pKa = 7.72NYY3 pKa = 7.62QTFARR8 pKa = 11.84LYY10 pKa = 9.65DD11 pKa = 3.45QLFDD15 pKa = 3.67EE16 pKa = 5.02EE17 pKa = 5.96AYY19 pKa = 10.36EE20 pKa = 4.19DD21 pKa = 3.53WLAYY25 pKa = 8.89AHH27 pKa = 5.95QVIRR31 pKa = 11.84QPEE34 pKa = 4.5GPLLEE39 pKa = 4.42LAGGAGRR46 pKa = 11.84LAIMMKK52 pKa = 8.55QTGFPEE58 pKa = 4.15VMNFDD63 pKa = 4.15LSEE66 pKa = 4.1EE67 pKa = 4.17MLTLAAEE74 pKa = 4.6HH75 pKa = 6.03AQEE78 pKa = 5.41AGVQLPLIQGDD89 pKa = 3.52MRR91 pKa = 11.84EE92 pKa = 4.01WSGLEE97 pKa = 3.83LTFQTITCFADD108 pKa = 3.27SLNYY112 pKa = 10.39LADD115 pKa = 3.93EE116 pKa = 4.19QALLQTFQQVAQHH129 pKa = 6.1LVVGGQFIFDD139 pKa = 4.44VITPKK144 pKa = 9.23QTDD147 pKa = 4.22DD148 pKa = 3.34IYY150 pKa = 10.87PGYY153 pKa = 9.25MYY155 pKa = 10.7NWHH158 pKa = 7.39DD159 pKa = 3.78EE160 pKa = 3.91QTAFMWSSFAVPEE173 pKa = 4.04VAHH176 pKa = 5.94QIEE179 pKa = 4.5HH180 pKa = 6.66EE181 pKa = 4.41LTFFMYY187 pKa = 10.38QEE189 pKa = 4.92EE190 pKa = 4.33IDD192 pKa = 4.87GYY194 pKa = 8.54QQVQEE199 pKa = 3.98FHH201 pKa = 6.32MEE203 pKa = 3.68RR204 pKa = 11.84TYY206 pKa = 11.33PLATYY211 pKa = 9.79QHH213 pKa = 7.54LLTKK217 pKa = 10.6AGFSNIQVSANYY229 pKa = 9.71GKK231 pKa = 10.13QDD233 pKa = 3.95DD234 pKa = 4.29LAGATRR240 pKa = 11.84WFFNVTKK247 pKa = 10.22EE248 pKa = 3.89
Molecular weight: 28.65 kDa
Isoelectric point according different methods:
Protein with the highest isoelectric point:
>tr|A0A0R2G5Z5|A0A0R2G5Z5_9LACO Purine-cytosine permease related protein OS=Weissella halotolerans DSM 20190 OX=1123500 GN=IV68_GL000395 PE=3 SV=1
MM1 pKa = 7.36KK2 pKa = 9.43RR3 pKa = 11.84TYY5 pKa = 9.69QPKK8 pKa = 8.34KK9 pKa = 7.47RR10 pKa = 11.84HH11 pKa = 5.71RR12 pKa = 11.84EE13 pKa = 3.7RR14 pKa = 11.84VHH16 pKa = 6.23GFRR19 pKa = 11.84KK20 pKa = 10.04RR21 pKa = 11.84MSTSNGRR28 pKa = 11.84KK29 pKa = 8.01VLARR33 pKa = 11.84RR34 pKa = 11.84RR35 pKa = 11.84QKK37 pKa = 10.39GRR39 pKa = 11.84KK40 pKa = 8.52VLSAA44 pKa = 4.05
MM1 pKa = 7.36KK2 pKa = 9.43RR3 pKa = 11.84TYY5 pKa = 9.69QPKK8 pKa = 8.34KK9 pKa = 7.47RR10 pKa = 11.84HH11 pKa = 5.71RR12 pKa = 11.84EE13 pKa = 3.7RR14 pKa = 11.84VHH16 pKa = 6.23GFRR19 pKa = 11.84KK20 pKa = 10.04RR21 pKa = 11.84MSTSNGRR28 pKa = 11.84KK29 pKa = 8.01VLARR33 pKa = 11.84RR34 pKa = 11.84RR35 pKa = 11.84QKK37 pKa = 10.39GRR39 pKa = 11.84KK40 pKa = 8.52VLSAA44 pKa = 4.05
Molecular weight: 5.38 kDa
Isoelectric point according different methods:
Peptides (in silico digests for buttom-up proteomics)
Below you can find in silico digests of the whole proteome with Trypsin, Chymotrypsin, Trypsin+LysC, LysN, ArgC proteases suitable for different mass spec machines.| Try ESI |
 |
|---|
| ChTry ESI |
 |
|---|
| ArgC ESI |
 |
|---|
| LysN ESI |
 |
|---|
| TryLysC ESI |
 |
|---|
| Try MALDI |
 |
|---|
| ChTry MALDI |
 |
|---|
| ArgC MALDI |
 |
|---|
| LysN MALDI |
 |
|---|
| TryLysC MALDI |
 |
|---|
| Try LTQ |
 |
|---|
| ChTry LTQ |
 |
|---|
| ArgC LTQ |
 |
|---|
| LysN LTQ |
 |
|---|
| TryLysC LTQ |
 |
|---|
| Try MSlow |
 |
|---|
| ChTry MSlow |
 |
|---|
| ArgC MSlow |
 |
|---|
| LysN MSlow |
 |
|---|
| TryLysC MSlow |
 |
|---|
| Try MShigh |
 |
|---|
| ChTry MShigh |
 |
|---|
| ArgC MShigh |
 |
|---|
| LysN MShigh |
 |
|---|
| TryLysC MShigh |
 |
|---|
General Statistics
Number of major isoforms |
Number of additional isoforms |
Number of all proteins |
Number of amino acids |
Min. Seq. Length |
Max. Seq. Length |
Avg. Seq. Length |
Avg. Mol. Weight |
|---|---|---|---|---|---|---|---|
0 |
402550 |
44 |
1433 |
308.7 |
34.21 |
Amino acid frequency
Ala |
Cys |
Asp |
Glu |
Phe |
Gly |
His |
Ile |
Lys |
Leu |
|---|---|---|---|---|---|---|---|---|---|
9.696 ± 0.066 | 0.225 ± 0.012 |
5.784 ± 0.06 | 5.246 ± 0.062 |
3.94 ± 0.048 | 7.006 ± 0.055 |
2.198 ± 0.03 | 6.187 ± 0.053 |
5.271 ± 0.057 | 10.502 ± 0.079 |
Met |
Asn |
Gln |
Pro |
Arg |
Ser |
Thr |
Val |
Trp |
Tyr |
|---|---|---|---|---|---|---|---|---|---|
2.781 ± 0.035 | 3.834 ± 0.042 |
3.938 ± 0.036 | 5.542 ± 0.066 |
4.487 ± 0.061 | 5.078 ± 0.05 |
6.194 ± 0.053 | 7.547 ± 0.059 |
1.162 ± 0.032 | 3.34 ± 0.046 |
Most of the basic statistics you can see at this page can be downloaded from this CSV file
Proteome-pI is available under Creative Commons Attribution-NoDerivs license, for more details see here
| Reference: Kozlowski LP. Proteome-pI 2.0: Proteome Isoelectric Point Database Update. Nucleic Acids Res. 2021, doi: 10.1093/nar/gkab944 | Contact: Lukasz P. Kozlowski |
