Lacinutrix sp. (strain 5H-3-7-4)
Taxonomy: cellular organisms; Bacteria; FCB group; Bacteroidetes/Chlorobi group; Bacteroidetes; Flavobacteriia; Flavobacteriales; Flavobacteriaceae; Lacinutrix; unclassified Lacinutrix
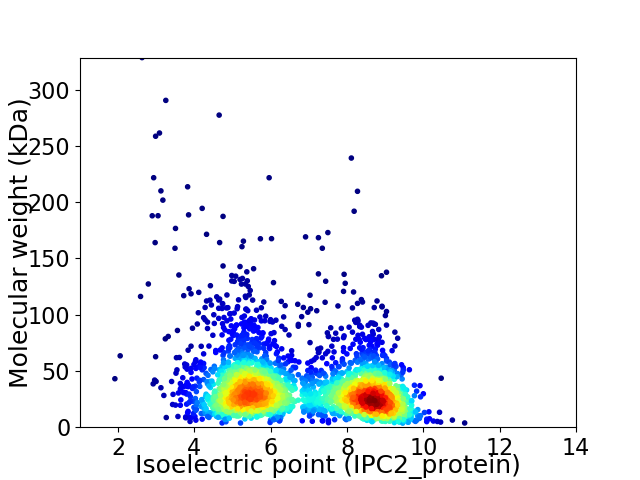
Average proteome isoelectric point is 6.81
Get precalculated fractions of proteins

Virtual 2D-PAGE plot for 2958 proteins (isoelectric point calculated using IPC2_protein)
Get csv file with sequences according to given criteria:
* You can choose from 21 different methods for calculating isoelectric point
Summary statistics related to proteome-wise predictions


Protein with the lowest isoelectric point:
>tr|F6GC29|F6GC29_LACS5 DNA repair protein RadC OS=Lacinutrix sp. (strain 5H-3-7-4) OX=983544 GN=Lacal_0432 PE=3 SV=1
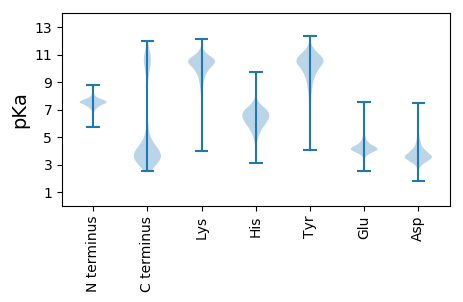
MM1 pKa = 7.53KK2 pKa = 9.96NIKK5 pKa = 10.04YY6 pKa = 10.11IIILLFVAAFNYY18 pKa = 10.37ACEE21 pKa = 4.23NDD23 pKa = 3.66DD24 pKa = 4.17SIEE27 pKa = 4.11RR28 pKa = 11.84RR29 pKa = 11.84GKK31 pKa = 9.47PAITVLNKK39 pKa = 9.56TVTVTEE45 pKa = 4.49GEE47 pKa = 4.29TATFDD52 pKa = 4.57LEE54 pKa = 3.84VDD56 pKa = 3.81YY57 pKa = 11.52AVANPINIRR66 pKa = 11.84IDD68 pKa = 3.48VLDD71 pKa = 4.27DD72 pKa = 3.24QGNPLVVTLPSGAPDD87 pKa = 3.72SGNGLYY93 pKa = 10.76DD94 pKa = 4.09LVTLEE99 pKa = 5.26DD100 pKa = 3.67VFVPYY105 pKa = 9.05NTWFEE110 pKa = 4.14SGYY113 pKa = 9.97FQYY116 pKa = 10.92GYY118 pKa = 9.24TGGTGYY124 pKa = 10.31IANFPAGQTSLQINIEE140 pKa = 4.16TLQDD144 pKa = 4.49FIPNDD149 pKa = 3.81TKK151 pKa = 10.79IVNLKK156 pKa = 8.49FTSTNLLEE164 pKa = 4.07ATIDD168 pKa = 3.61EE169 pKa = 4.42VVSINIEE176 pKa = 4.05NFVSNSLITRR186 pKa = 11.84LDD188 pKa = 2.98WSGDD192 pKa = 3.55YY193 pKa = 10.71LDD195 pKa = 5.67NGINPCDD202 pKa = 3.97GDD204 pKa = 3.8TALDD208 pKa = 4.11LDD210 pKa = 4.83LEE212 pKa = 4.54LYY214 pKa = 10.95YY215 pKa = 11.23NGAFTDD221 pKa = 4.91FSYY224 pKa = 11.06SEE226 pKa = 4.47CPEE229 pKa = 4.03EE230 pKa = 4.72LTILDD235 pKa = 4.0TDD237 pKa = 3.8PDD239 pKa = 3.62GTYY242 pKa = 10.38EE243 pKa = 3.86IDD245 pKa = 3.25ASFWTSNGNTSSTVTNVPTTIIFTKK270 pKa = 10.34PGIFYY275 pKa = 10.65QEE277 pKa = 3.61VDD279 pKa = 3.18ISSVFPLADD288 pKa = 3.84GGLSDD293 pKa = 4.83GNSSAITTFTVTKK306 pKa = 9.83TGTTYY311 pKa = 10.82TVTDD315 pKa = 3.87SNNTQIAQGRR325 pKa = 11.84NSNYY329 pKa = 10.35RR330 pKa = 11.84ITKK333 pKa = 5.51TQKK336 pKa = 10.2KK337 pKa = 7.03QFKK340 pKa = 9.98
MM1 pKa = 7.53KK2 pKa = 9.96NIKK5 pKa = 10.04YY6 pKa = 10.11IIILLFVAAFNYY18 pKa = 10.37ACEE21 pKa = 4.23NDD23 pKa = 3.66DD24 pKa = 4.17SIEE27 pKa = 4.11RR28 pKa = 11.84RR29 pKa = 11.84GKK31 pKa = 9.47PAITVLNKK39 pKa = 9.56TVTVTEE45 pKa = 4.49GEE47 pKa = 4.29TATFDD52 pKa = 4.57LEE54 pKa = 3.84VDD56 pKa = 3.81YY57 pKa = 11.52AVANPINIRR66 pKa = 11.84IDD68 pKa = 3.48VLDD71 pKa = 4.27DD72 pKa = 3.24QGNPLVVTLPSGAPDD87 pKa = 3.72SGNGLYY93 pKa = 10.76DD94 pKa = 4.09LVTLEE99 pKa = 5.26DD100 pKa = 3.67VFVPYY105 pKa = 9.05NTWFEE110 pKa = 4.14SGYY113 pKa = 9.97FQYY116 pKa = 10.92GYY118 pKa = 9.24TGGTGYY124 pKa = 10.31IANFPAGQTSLQINIEE140 pKa = 4.16TLQDD144 pKa = 4.49FIPNDD149 pKa = 3.81TKK151 pKa = 10.79IVNLKK156 pKa = 8.49FTSTNLLEE164 pKa = 4.07ATIDD168 pKa = 3.61EE169 pKa = 4.42VVSINIEE176 pKa = 4.05NFVSNSLITRR186 pKa = 11.84LDD188 pKa = 2.98WSGDD192 pKa = 3.55YY193 pKa = 10.71LDD195 pKa = 5.67NGINPCDD202 pKa = 3.97GDD204 pKa = 3.8TALDD208 pKa = 4.11LDD210 pKa = 4.83LEE212 pKa = 4.54LYY214 pKa = 10.95YY215 pKa = 11.23NGAFTDD221 pKa = 4.91FSYY224 pKa = 11.06SEE226 pKa = 4.47CPEE229 pKa = 4.03EE230 pKa = 4.72LTILDD235 pKa = 4.0TDD237 pKa = 3.8PDD239 pKa = 3.62GTYY242 pKa = 10.38EE243 pKa = 3.86IDD245 pKa = 3.25ASFWTSNGNTSSTVTNVPTTIIFTKK270 pKa = 10.34PGIFYY275 pKa = 10.65QEE277 pKa = 3.61VDD279 pKa = 3.18ISSVFPLADD288 pKa = 3.84GGLSDD293 pKa = 4.83GNSSAITTFTVTKK306 pKa = 9.83TGTTYY311 pKa = 10.82TVTDD315 pKa = 3.87SNNTQIAQGRR325 pKa = 11.84NSNYY329 pKa = 10.35RR330 pKa = 11.84ITKK333 pKa = 5.51TQKK336 pKa = 10.2KK337 pKa = 7.03QFKK340 pKa = 9.98
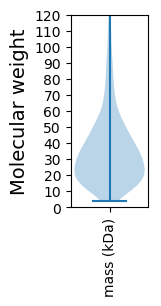
Molecular weight: 37.4 kDa
Isoelectric point according different methods:
Protein with the highest isoelectric point:
>tr|F6GHH9|F6GHH9_LACS5 Gliding motility-associated protein GldE OS=Lacinutrix sp. (strain 5H-3-7-4) OX=983544 GN=Lacal_1224 PE=3 SV=1
MM1 pKa = 7.84PSGKK5 pKa = 9.32KK6 pKa = 9.59RR7 pKa = 11.84KK8 pKa = 7.05RR9 pKa = 11.84HH10 pKa = 5.11KK11 pKa = 10.59VATHH15 pKa = 5.21KK16 pKa = 10.3RR17 pKa = 11.84KK18 pKa = 9.62KK19 pKa = 9.04RR20 pKa = 11.84RR21 pKa = 11.84RR22 pKa = 11.84ANRR25 pKa = 11.84HH26 pKa = 4.77KK27 pKa = 10.58KK28 pKa = 9.8KK29 pKa = 10.51KK30 pKa = 10.04
MM1 pKa = 7.84PSGKK5 pKa = 9.32KK6 pKa = 9.59RR7 pKa = 11.84KK8 pKa = 7.05RR9 pKa = 11.84HH10 pKa = 5.11KK11 pKa = 10.59VATHH15 pKa = 5.21KK16 pKa = 10.3RR17 pKa = 11.84KK18 pKa = 9.62KK19 pKa = 9.04RR20 pKa = 11.84RR21 pKa = 11.84RR22 pKa = 11.84ANRR25 pKa = 11.84HH26 pKa = 4.77KK27 pKa = 10.58KK28 pKa = 9.8KK29 pKa = 10.51KK30 pKa = 10.04
Molecular weight: 3.76 kDa
Isoelectric point according different methods:
Peptides (in silico digests for buttom-up proteomics)
Below you can find in silico digests of the whole proteome with Trypsin, Chymotrypsin, Trypsin+LysC, LysN, ArgC proteases suitable for different mass spec machines.| Try ESI |
 |
|---|
| ChTry ESI |
 |
|---|
| ArgC ESI |
 |
|---|
| LysN ESI |
 |
|---|
| TryLysC ESI |
 |
|---|
| Try MALDI |
 |
|---|
| ChTry MALDI |
 |
|---|
| ArgC MALDI |
 |
|---|
| LysN MALDI |
 |
|---|
| TryLysC MALDI |
 |
|---|
| Try LTQ |
 |
|---|
| ChTry LTQ |
 |
|---|
| ArgC LTQ |
 |
|---|
| LysN LTQ |
 |
|---|
| TryLysC LTQ |
 |
|---|
| Try MSlow |
 |
|---|
| ChTry MSlow |
 |
|---|
| ArgC MSlow |
 |
|---|
| LysN MSlow |
 |
|---|
| TryLysC MSlow |
 |
|---|
| Try MShigh |
 |
|---|
| ChTry MShigh |
 |
|---|
| ArgC MShigh |
 |
|---|
| LysN MShigh |
 |
|---|
| TryLysC MShigh |
 |
|---|
General Statistics
Number of major isoforms |
Number of additional isoforms |
Number of all proteins |
Number of amino acids |
Min. Seq. Length |
Max. Seq. Length |
Avg. Seq. Length |
Avg. Mol. Weight |
|---|---|---|---|---|---|---|---|
0 |
1005557 |
30 |
3167 |
339.9 |
38.33 |
Amino acid frequency
Ala |
Cys |
Asp |
Glu |
Phe |
Gly |
His |
Ile |
Lys |
Leu |
|---|---|---|---|---|---|---|---|---|---|
6.414 ± 0.044 | 0.769 ± 0.021 |
5.58 ± 0.06 | 6.461 ± 0.046 |
5.256 ± 0.042 | 6.009 ± 0.051 |
1.636 ± 0.023 | 8.152 ± 0.042 |
8.21 ± 0.085 | 9.101 ± 0.062 |
Met |
Asn |
Gln |
Pro |
Arg |
Ser |
Thr |
Val |
Trp |
Tyr |
|---|---|---|---|---|---|---|---|---|---|
1.979 ± 0.024 | 7.065 ± 0.053 |
3.19 ± 0.032 | 3.332 ± 0.026 |
3.044 ± 0.032 | 6.32 ± 0.038 |
6.396 ± 0.076 | 6.118 ± 0.041 |
0.939 ± 0.017 | 4.027 ± 0.03 |
Most of the basic statistics you can see at this page can be downloaded from this CSV file
Proteome-pI is available under Creative Commons Attribution-NoDerivs license, for more details see here
| Reference: Kozlowski LP. Proteome-pI 2.0: Proteome Isoelectric Point Database Update. Nucleic Acids Res. 2021, doi: 10.1093/nar/gkab944 | Contact: Lukasz P. Kozlowski |
