Atlantibacter hermannii NBRC 105704
Taxonomy: cellular organisms; Bacteria; Proteobacteria; Gammaproteobacteria; Enterobacterales; Enterobacteriaceae; Atlantibacter; Atlantibacter hermannii
Average proteome isoelectric point is 6.5
Get precalculated fractions of proteins

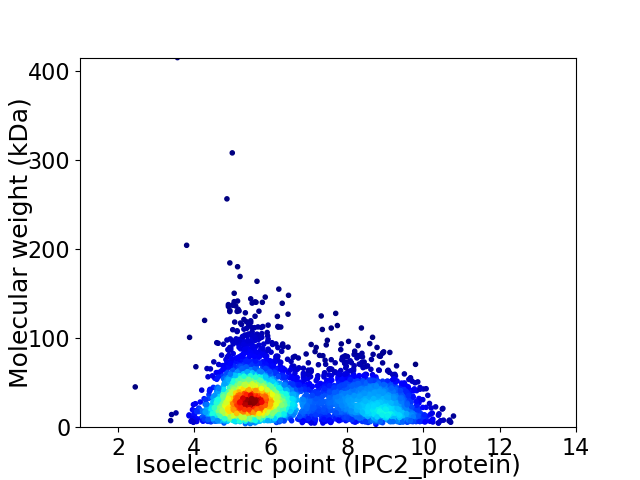
Virtual 2D-PAGE plot for 4159 proteins (isoelectric point calculated using IPC2_protein)
Get csv file with sequences according to given criteria:
* You can choose from 21 different methods for calculating isoelectric point
Summary statistics related to proteome-wise predictions


Protein with the lowest isoelectric point:
>tr|H5V0I1|H5V0I1_ATLHE DNA mismatch repair protein MutS OS=Atlantibacter hermannii NBRC 105704 OX=1115512 GN=mutS PE=3 SV=1
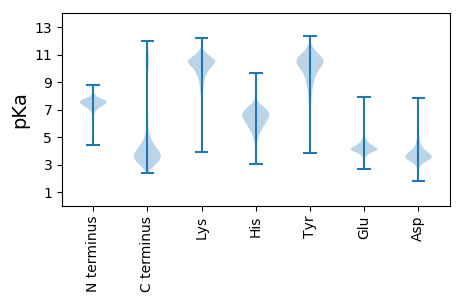
MM1 pKa = 7.62NMGLFYY7 pKa = 10.89GSSTCYY13 pKa = 10.49TEE15 pKa = 3.84MAAEE19 pKa = 5.12KK20 pKa = 10.0IRR22 pKa = 11.84DD23 pKa = 3.65IIGPEE28 pKa = 4.02LVTLHH33 pKa = 6.14NLKK36 pKa = 10.64DD37 pKa = 3.68DD38 pKa = 4.36APALMEE44 pKa = 4.2QYY46 pKa = 10.98DD47 pKa = 4.12VLILGIPTWDD57 pKa = 3.26FGEE60 pKa = 4.22IQEE63 pKa = 4.35DD64 pKa = 3.97WEE66 pKa = 4.89AIWDD70 pKa = 3.89QLDD73 pKa = 3.66TLDD76 pKa = 4.17LAGKK80 pKa = 9.72IVALYY85 pKa = 11.07GMGDD89 pKa = 3.29QLGYY93 pKa = 11.02GEE95 pKa = 4.87WFLDD99 pKa = 3.74ALGMLHH105 pKa = 7.44DD106 pKa = 4.34KK107 pKa = 11.0LMPKK111 pKa = 9.82GVKK114 pKa = 9.57FVGYY118 pKa = 9.0WPTEE122 pKa = 4.03GYY124 pKa = 10.61EE125 pKa = 4.19FTSPKK130 pKa = 10.02PVIADD135 pKa = 3.41GQLFVGLALDD145 pKa = 3.64EE146 pKa = 4.38TNQYY150 pKa = 10.89DD151 pKa = 4.3LSDD154 pKa = 3.47EE155 pKa = 5.91RR156 pKa = 11.84IQQWCEE162 pKa = 3.62QILGEE167 pKa = 4.17MAEE170 pKa = 4.4HH171 pKa = 7.09FSS173 pKa = 3.73
MM1 pKa = 7.62NMGLFYY7 pKa = 10.89GSSTCYY13 pKa = 10.49TEE15 pKa = 3.84MAAEE19 pKa = 5.12KK20 pKa = 10.0IRR22 pKa = 11.84DD23 pKa = 3.65IIGPEE28 pKa = 4.02LVTLHH33 pKa = 6.14NLKK36 pKa = 10.64DD37 pKa = 3.68DD38 pKa = 4.36APALMEE44 pKa = 4.2QYY46 pKa = 10.98DD47 pKa = 4.12VLILGIPTWDD57 pKa = 3.26FGEE60 pKa = 4.22IQEE63 pKa = 4.35DD64 pKa = 3.97WEE66 pKa = 4.89AIWDD70 pKa = 3.89QLDD73 pKa = 3.66TLDD76 pKa = 4.17LAGKK80 pKa = 9.72IVALYY85 pKa = 11.07GMGDD89 pKa = 3.29QLGYY93 pKa = 11.02GEE95 pKa = 4.87WFLDD99 pKa = 3.74ALGMLHH105 pKa = 7.44DD106 pKa = 4.34KK107 pKa = 11.0LMPKK111 pKa = 9.82GVKK114 pKa = 9.57FVGYY118 pKa = 9.0WPTEE122 pKa = 4.03GYY124 pKa = 10.61EE125 pKa = 4.19FTSPKK130 pKa = 10.02PVIADD135 pKa = 3.41GQLFVGLALDD145 pKa = 3.64EE146 pKa = 4.38TNQYY150 pKa = 10.89DD151 pKa = 4.3LSDD154 pKa = 3.47EE155 pKa = 5.91RR156 pKa = 11.84IQQWCEE162 pKa = 3.62QILGEE167 pKa = 4.17MAEE170 pKa = 4.4HH171 pKa = 7.09FSS173 pKa = 3.73
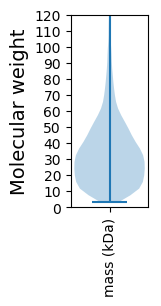
Molecular weight: 19.61 kDa
Isoelectric point according different methods:
Protein with the highest isoelectric point:
>tr|H5V3R1|H5V3R1_ATLHE AAA_15 domain-containing protein OS=Atlantibacter hermannii NBRC 105704 OX=1115512 GN=EH105704_07_01870 PE=4 SV=1
MM1 pKa = 7.05LTVPALCWLCGMPLALSHH19 pKa = 6.84WGLCSRR25 pKa = 11.84CVAALPAPPPACPVCGLPAVVTTMPCGRR53 pKa = 11.84CLHH56 pKa = 6.57KK57 pKa = 10.73PPAWEE62 pKa = 3.71RR63 pKa = 11.84LLYY66 pKa = 8.74VTDD69 pKa = 3.59YY70 pKa = 10.23CQPLSALVQALKK82 pKa = 9.87FHH84 pKa = 6.71RR85 pKa = 11.84QTALAKK91 pKa = 9.63PLARR95 pKa = 11.84LMLLRR100 pKa = 11.84ARR102 pKa = 11.84EE103 pKa = 4.11ALRR106 pKa = 11.84EE107 pKa = 3.96QAFPRR112 pKa = 11.84PDD114 pKa = 3.38LVIGVPLHH122 pKa = 7.01RR123 pKa = 11.84RR124 pKa = 11.84RR125 pKa = 11.84AWHH128 pKa = 6.6RR129 pKa = 11.84GFNQSALLAKK139 pKa = 10.14PLARR143 pKa = 11.84WLGCRR148 pKa = 11.84YY149 pKa = 10.0DD150 pKa = 4.13DD151 pKa = 3.83RR152 pKa = 11.84VLRR155 pKa = 11.84RR156 pKa = 11.84IRR158 pKa = 11.84STPVQHH164 pKa = 6.68HH165 pKa = 6.3LSARR169 pKa = 11.84LRR171 pKa = 11.84KK172 pKa = 9.53KK173 pKa = 10.13NLRR176 pKa = 11.84AAFRR180 pKa = 11.84LEE182 pKa = 3.94LPVRR186 pKa = 11.84DD187 pKa = 3.64LHH189 pKa = 8.32IVIVDD194 pKa = 3.75DD195 pKa = 4.22VVTTGSTVGEE205 pKa = 4.18MAKK208 pKa = 10.44LLHH211 pKa = 6.17RR212 pKa = 11.84HH213 pKa = 5.48GAATVQVWCLCRR225 pKa = 11.84TLL227 pKa = 4.39
MM1 pKa = 7.05LTVPALCWLCGMPLALSHH19 pKa = 6.84WGLCSRR25 pKa = 11.84CVAALPAPPPACPVCGLPAVVTTMPCGRR53 pKa = 11.84CLHH56 pKa = 6.57KK57 pKa = 10.73PPAWEE62 pKa = 3.71RR63 pKa = 11.84LLYY66 pKa = 8.74VTDD69 pKa = 3.59YY70 pKa = 10.23CQPLSALVQALKK82 pKa = 9.87FHH84 pKa = 6.71RR85 pKa = 11.84QTALAKK91 pKa = 9.63PLARR95 pKa = 11.84LMLLRR100 pKa = 11.84ARR102 pKa = 11.84EE103 pKa = 4.11ALRR106 pKa = 11.84EE107 pKa = 3.96QAFPRR112 pKa = 11.84PDD114 pKa = 3.38LVIGVPLHH122 pKa = 7.01RR123 pKa = 11.84RR124 pKa = 11.84RR125 pKa = 11.84AWHH128 pKa = 6.6RR129 pKa = 11.84GFNQSALLAKK139 pKa = 10.14PLARR143 pKa = 11.84WLGCRR148 pKa = 11.84YY149 pKa = 10.0DD150 pKa = 4.13DD151 pKa = 3.83RR152 pKa = 11.84VLRR155 pKa = 11.84RR156 pKa = 11.84IRR158 pKa = 11.84STPVQHH164 pKa = 6.68HH165 pKa = 6.3LSARR169 pKa = 11.84LRR171 pKa = 11.84KK172 pKa = 9.53KK173 pKa = 10.13NLRR176 pKa = 11.84AAFRR180 pKa = 11.84LEE182 pKa = 3.94LPVRR186 pKa = 11.84DD187 pKa = 3.64LHH189 pKa = 8.32IVIVDD194 pKa = 3.75DD195 pKa = 4.22VVTTGSTVGEE205 pKa = 4.18MAKK208 pKa = 10.44LLHH211 pKa = 6.17RR212 pKa = 11.84HH213 pKa = 5.48GAATVQVWCLCRR225 pKa = 11.84TLL227 pKa = 4.39
Molecular weight: 25.52 kDa
Isoelectric point according different methods:
Peptides (in silico digests for buttom-up proteomics)
Below you can find in silico digests of the whole proteome with Trypsin, Chymotrypsin, Trypsin+LysC, LysN, ArgC proteases suitable for different mass spec machines.| Try ESI |
 |
|---|
| ChTry ESI |
 |
|---|
| ArgC ESI |
 |
|---|
| LysN ESI |
 |
|---|
| TryLysC ESI |
 |
|---|
| Try MALDI |
 |
|---|
| ChTry MALDI |
 |
|---|
| ArgC MALDI |
 |
|---|
| LysN MALDI |
 |
|---|
| TryLysC MALDI |
 |
|---|
| Try LTQ |
 |
|---|
| ChTry LTQ |
 |
|---|
| ArgC LTQ |
 |
|---|
| LysN LTQ |
 |
|---|
| TryLysC LTQ |
 |
|---|
| Try MSlow |
 |
|---|
| ChTry MSlow |
 |
|---|
| ArgC MSlow |
 |
|---|
| LysN MSlow |
 |
|---|
| TryLysC MSlow |
 |
|---|
| Try MShigh |
 |
|---|
| ChTry MShigh |
 |
|---|
| ArgC MShigh |
 |
|---|
| LysN MShigh |
 |
|---|
| TryLysC MShigh |
 |
|---|
General Statistics
Number of major isoforms |
Number of additional isoforms |
Number of all proteins |
Number of amino acids |
Min. Seq. Length |
Max. Seq. Length |
Avg. Seq. Length |
Avg. Mol. Weight |
|---|---|---|---|---|---|---|---|
0 |
1323175 |
29 |
4081 |
318.1 |
35.12 |
Amino acid frequency
Ala |
Cys |
Asp |
Glu |
Phe |
Gly |
His |
Ile |
Lys |
Leu |
|---|---|---|---|---|---|---|---|---|---|
10.027 ± 0.046 | 1.083 ± 0.014 |
5.273 ± 0.031 | 5.602 ± 0.034 |
3.834 ± 0.03 | 7.505 ± 0.044 |
2.29 ± 0.02 | 5.703 ± 0.031 |
4.088 ± 0.032 | 10.773 ± 0.052 |
Met |
Asn |
Gln |
Pro |
Arg |
Ser |
Thr |
Val |
Trp |
Tyr |
|---|---|---|---|---|---|---|---|---|---|
2.765 ± 0.02 | 3.733 ± 0.029 |
4.542 ± 0.029 | 4.455 ± 0.033 |
5.751 ± 0.033 | 5.791 ± 0.029 |
5.404 ± 0.033 | 7.149 ± 0.033 |
1.526 ± 0.018 | 2.705 ± 0.018 |
Most of the basic statistics you can see at this page can be downloaded from this CSV file
Proteome-pI is available under Creative Commons Attribution-NoDerivs license, for more details see here
| Reference: Kozlowski LP. Proteome-pI 2.0: Proteome Isoelectric Point Database Update. Nucleic Acids Res. 2021, doi: 10.1093/nar/gkab944 | Contact: Lukasz P. Kozlowski |
